Litecoin (LTC/USD) Price Resorts to Confluences, Following a Peak
Estimated Reading Time: 3 minutes
Don’t invest unless you’re prepared to lose all the money you invest. This is a high-risk investment and you are unlikely to be protected if something goes wrong. Take 2 minutes to learn more
Litecoin Price Prediction – July 4
The valuation of Litecoin has resorted to confluences, following a peak moment against the trade line of the US Dollar around $115.
About five days into this crypto economy, a sudden shoot up from above the line of $80 has now relaxed the velocity to the upside at a minimal percentage rate of 0.31 positive, trading between the high and low value points of $109.601711 and $105.035319. The present situation isn’t palatable for getting sustainable buy orders beyond the higher zones of the confluent trading areas.
LTC/USD Market
Key Levels:
Resistance levels: $120, $125, $130
Support levels: $95, $85, $75
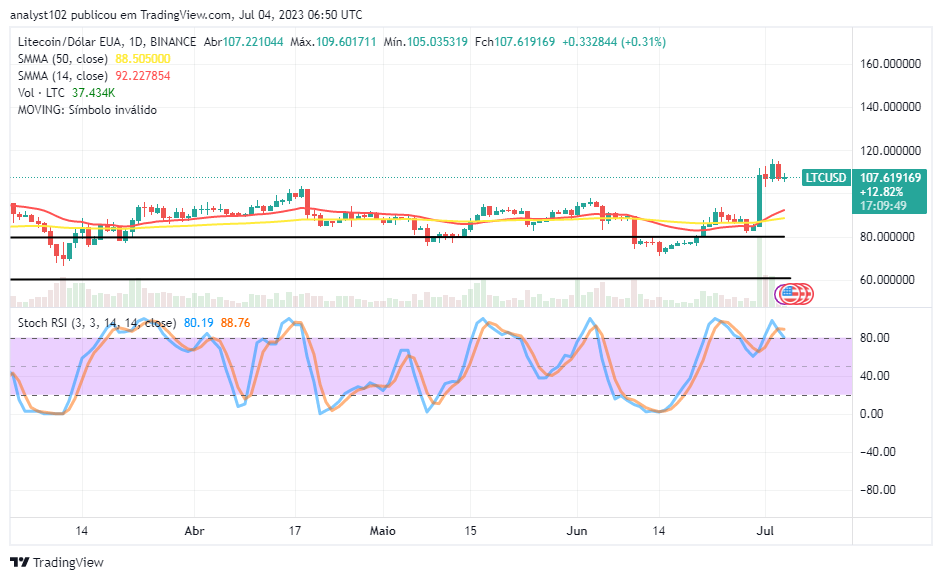
LTC/USD – Daily Chart
The LTC/USD daily chart reveals that the crypto-economic price resorts to confluences following a peak trade session near the resistance level of $120.
The 50-day SMA indicator is at $88.505000, and the 14-day SMA indicator is at $92.227854. A line of bearish candlesticks might be forming in a downward reversal mode toward finding a base around the trend line of the smaller SMA. The Stochastic Oscillators have crossed southbound from the overbought position to a position at 88.76 to 80.19 points.
What is the gravitational force situation like in the LTC/USD as compared to the last overbought condition?
The previous overbought situation was achieved around a high line of $90 before bulls added efforts during the 30th June session to make a sudden rise that has led the LTC/USD trade to confluences, flowing a peak around the level of $115.
As it has been observed that the LTC/USD market has had an overinflated valuation, long-position takers needed to resettle for a process of shifting back downward to a logical lower-trading zone to ascertain the need to swing back. It’s now time for buyers to caution against joining an abrupt upsurge that could, in no time, turn into a fake move.
On the downside of the technical analysis, the LTC/USD market bears must stand out firmly to detect a decent position of entry around the area of the price confluences. Time frames with lower rates of either 1 hour or 15 minutes will be instrumental in the early determination of shorting entries.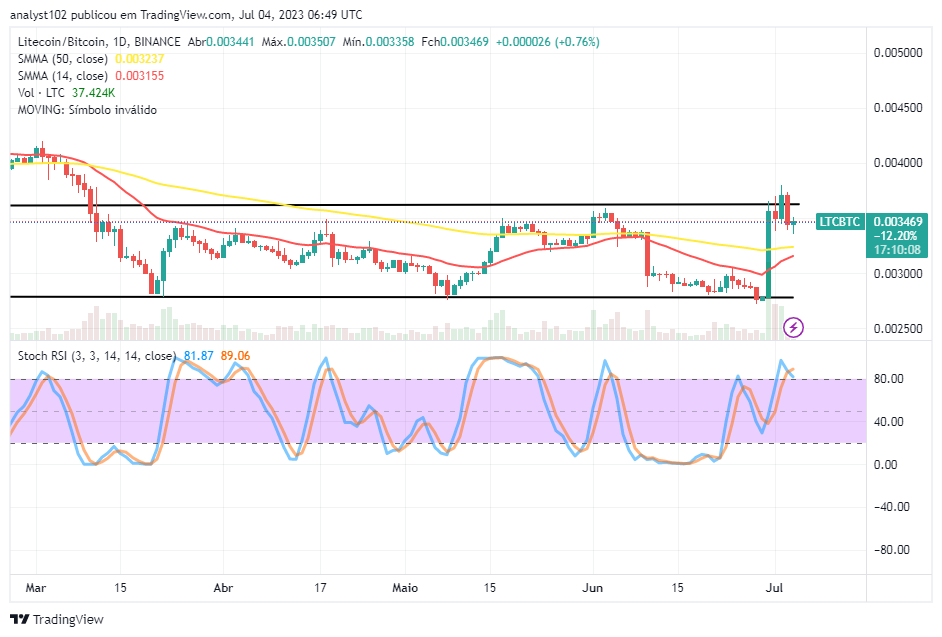
LTC/BTC Price Analysi
In contrast, Litecoin has resorted to confluences, following a peak at a higher resistance zone of the upper range line drawn.
The 14-day SMA indicator has briefly curved northward, close to the 50-day SMA indicator from beneath. The Stochastic Oscillators have moved into the overbought region, trying to cross back southbound between 89.06 and 81.87 levels. The base crypto may still run northward based on the left-over forces against bears. Nevertheless, the pairing crypto price has hit formidable resistance, suggesting that short-position takers will be making moves in the near future.
Note: Cryptosignals.org is not a financial advisor. Do your research before investing your funds in any financial asset or presented product or event. We are not responsible for your investing results.
You can purchase Lucky Block here. Buy LBLOCK