Litecoin (LTC/USD) Trade Has Had a High Swing, Getting Set for a Decline
Estimated Reading Time: 3 minutes
Don’t invest unless you’re prepared to lose all the money you invest. This is a high-risk investment and you are unlikely to be protected if something goes wrong. Take 2 minutes to learn more
Litecoin Price Prediction – June 26
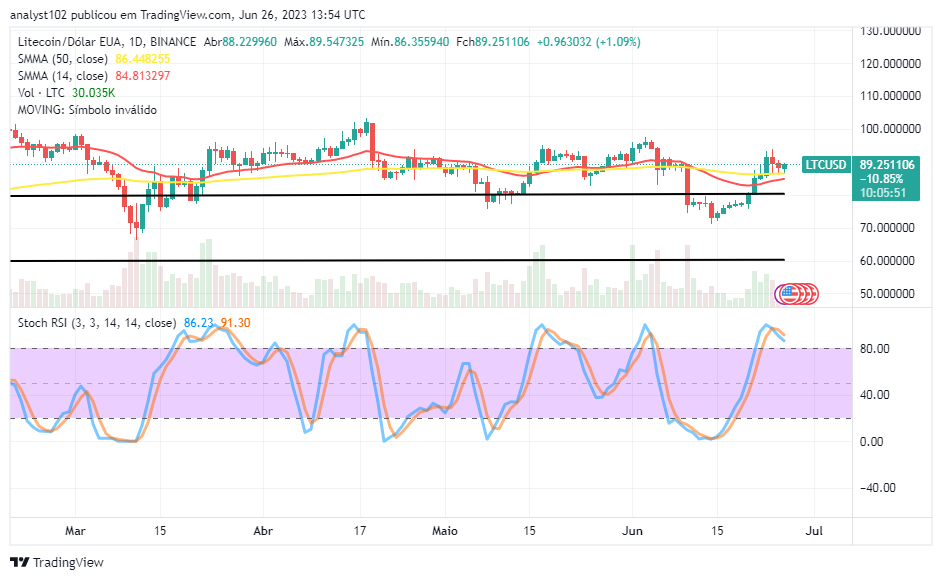
The LTC/USD trade has had a large swing, getting set for a decline as buying and selling operations have been carried out between the $86.355940 and $89.547325 value lines.
There may be a chain of consolidation movements, portending an overbought condition that might not be gaining smooth passage between the trade zones stated above. The price is trading around the $89.251106 level, keeping a 1.09 percentage rate positive. Long-position traders should be wary of pushing northward from the psychological baseline at a higher zone above $80.
LTC/USD Market
Key Levels:
Resistance levels: $95, $100, $105
Support levels: $80, $75, $70
LTC/USD – Daily Chart
The LTC/USD daily chart showcases that the crypto-economic trade has had a large swing and is getting set for a decline.
The 14-day SMA trend line is positioned at $84.813297 beneath the 86.448255 value lines. The Stochastic Oscillators are in the overbought region, briefly crossing southbound from 91.30 to 86.23 points. That shows the price has stepped up to the usual resistance levels of around $100.
Has the value of the LTC/USD market increased? Will the price continue to rise until it reaches the resistance level of $100?
The Litecoin market valuation is bound to push northward further for a completion near the resistance of $100 against the US currency as the crypto-economic trade has had a large swing from the depths of a lower zone, getting set for a decline. Buyers have to maintain a stance in a continuation of extending movements through variant resistances.
The LTC/USD market bears have been mustering energy between the points of $90 and $100, as indicated by the reading of Stochastic Oscillators. At this time, the market may be attempting fake bounces between those value lines to trigger sell limit position orders that may have been placed around them. A bearish candlestick against the SMA trend lines will probably give birth to a line of lows in sequential order.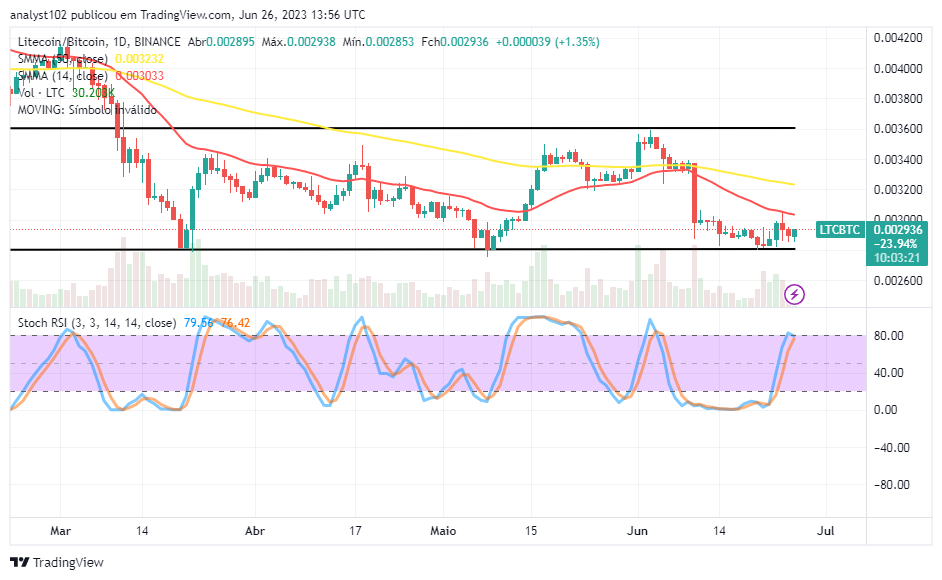
LTC/BTC Price Analysis
In contrast, Litecoin trade activities have been held back by the purchasing power of Bitcoin. The pair of crypto economies is getting set for a decline beneath the trend line of the smaller indicator.
The 14-day SMA indicator is slightly trending southward below the 50-day SMA indicator. The Stochastic Oscillators have swerved northbound to reposition briefly northbound between 79.56 and 76.42 levels to denote the base cryptocurrency is liable to a risk of pushing back down. But it might not go through lengthy support points in the aftermath of the recordings.
Note: Cryptosignals.org is not a financial advisor. Do your research before investing your funds in any financial asset or presented product or event. We are not responsible for your investing results.
You can purchase Lucky Block here. Buy LBLOCK