Litecoin (LTC/USD) Price May Go Under $80, Settling to Revisit $70
Estimated Reading Time: 4 minutes
Don’t invest unless you’re prepared to lose all the money you invest. This is a high-risk investment and you are unlikely to be protected if something goes wrong. Take 2 minutes to learn more
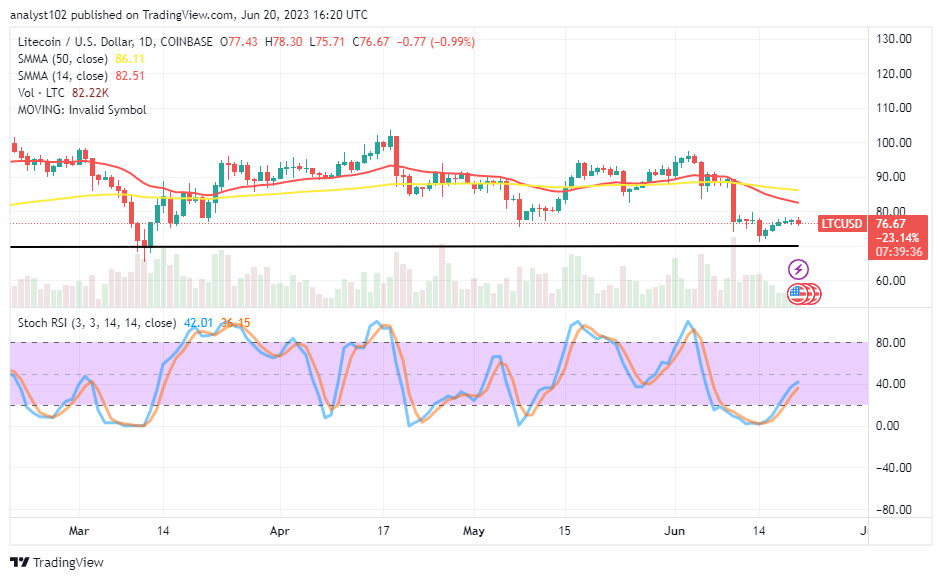
Litecoin Price Prediction – June 20
Some days back, the LTC/USD market operations witnessed a rallying motion toward averaging some resistance at the $80 line, settling to revisit the $70 support zone if the decline gets firmer. That situation has led the crypto economy to bargain between $78.30 and $75.71 at a minutely negative percentage rate of 0.99.
Indication on the current transaction indices showcases that bears are attempting to uphold their presence on the remaining falling pressure that has staged during the June 10th session that made an aggressive breakdown of the $80 previous pivotal line.
LTC/USD Market
Key Levels:
Resistance levels: $80, $85, $90
Support levels: $70, $65, $60
LTC/USD – Daily Chart
The LTC/USD daily chart showcases that the crypto-economic price may go under the $80 resistance line, settling to revisit the support level of $70 with the most potential afterward. In light of what the positioning outcome of the indicators portends presently, the 14-day SMA has crossed southward at $82.51, underneath the $86.11 value line of the 50-day SMA indicator. The Stochastic Oscillators indicate the possibility of witnessing a pause in the trading cycle around 42.01 to 36.15. An eventual moment that will produce a successful northbound cross may generate a consolidation movement in that direction.
What are the two most important aspects of the LTC/USD market now?
Buying and selling deals presently in the Litecoin trade against the US currency have been seen to be between the $80 and $70 value lines, as there could be room for sideways motion within those points.
Talking about the technical analysis of the upside direction, the LTC/USD market buyers may have to be cautious about making a re-buying entry if the current decline signal intensifies in the long run against the support level outlined at around $70. As quite a usual trade practice, long-position placers could execute a buy limit order closely or around the support trading zone within a specified time or days.
Short-position placers might intend to play alongside the current falling pace index from below the $80 resistance. But, they should observe the principle of trade guiding against any possible movement that can produce in no time to safeguard their order. In the meantime, bears stand a better chance of getting back into the market by staging a sell limit order between the points of the SMAs with a stop-loss order around the resistance of $90.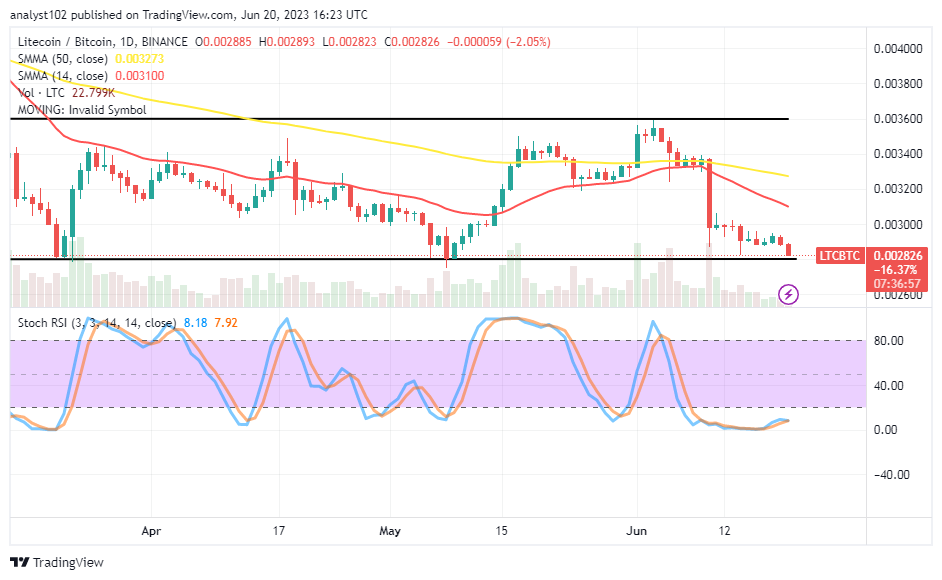
LTC/BTC Price Analysis
In contrast, the Litecoin market has been suppressed by Bitcoin’s trending ability in a consolidation manner, indicating that the pairing crypto operations could go further, settling to revisit some lows in that condition.
The 14-day SMA indicator is bent southward beneath the 50-day SMA indicator, ascertaining the pace of the devaluation. The Stochastic Oscillators have conjoined their lines in the oversold region, keeping 7.92 to 8.18 points. At this moment, it shows that the base crypto can push back for recovery against its counter-trading crypto once a big bullish candlestick emerges in no time.
Note: Cryptosignals.org is not a financial advisor. Do your research before investing your funds in any financial asset or presented product or event. We are not responsible for your investing results.
You can purchase Lucky Block here. Buy LBLOCK