Polygon (MATIC/USD) Trade Pushes Northward, Eyeing $0.60
Estimated Reading Time: 3 minutes
Don’t invest unless you’re prepared to lose all the money you invest. This is a high-risk investment and you are unlikely to be protected if something goes wrong. Take 2 minutes to learn more
Polygon Price Prediction – October 1
Following a pit stop session around the support line of $0.50 concerning the bargaining sessions of Polygon versus the US Dollar, the crypto-economic trade pushes northward from $0.50, eyeing the resistance line of $0.60.
The critical support level of $0.50 has served as a systemic base for the current northward-moving forces since the atmosphere for selling orders in the coming events is unlikely to be favorable. A closer look at the technicality signal note simply shows that the speeds supporting the appreciation motion have not been vigorous enough to produce significant returns.
MATIC/USD Market
Key Levels:
Resistance levels: $0.60, $0.65, $0.70
Support levels: $0.50, $0.45, $0.40
MATIC/USD – Daily Chart
The MATIC/USD daily chart reveals that the crypto-economic trade pushes northward from the support level of $0.50 and begins eyeing the barrier point of $0.60.
The 14-day SMA indicator is at the $0.535 value line underneath the $0.626 point of the 50-day SMA indicator. The stochastic oscillators are in slow-moving status, indicating that the rate pace is placed between 76.81 and 95.66. That implies that forces to back further rising motions have been on a gradual reduction procedure.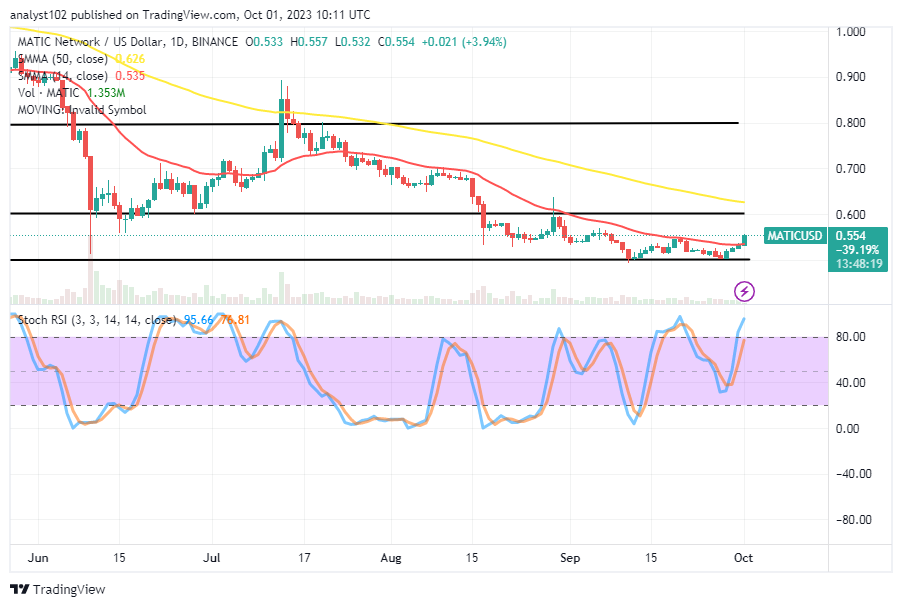
Is playing along the northward push on the north side from where it is now in the MATIC/USD market technically the best course of action for buyers?
Short- or medium-term traders may not be having good stances to bounce further into getting positive outcomes from the current trade point as the MATIC/USD trade pushes northward from the support zone of the $0.50, eyeing the $0.60 resistance.
The Bulls have now made the best efforts possible to maintain positions with a lower chance of losing out swiftly and dive into different underlying support lines if necessary. The $0.50 price point has been chosen as crucial support for the trade sector. Even the $0.60 and its lines below are designed to be areas where space can be created for investment portfolios.
Sellers should wait a while before launching shorting position orders because the market has been reasonably overbought. The area near either $0.60 resistance or its bigger moving average, which is situated a bit to the north, is where the northward pushes are expected to land in the interim.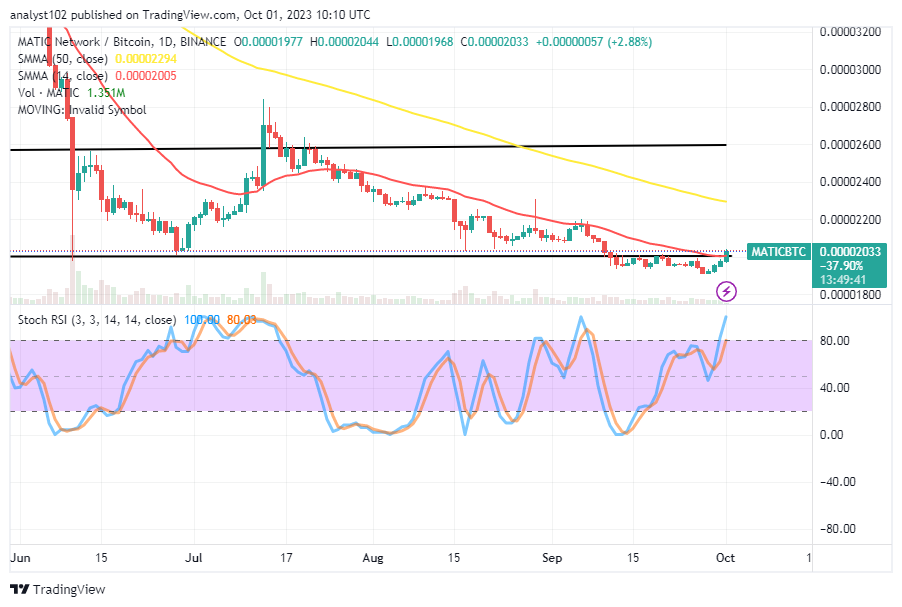
MATIC/BTC Price Analysis
In comparison, the Polygon trade pushes northward from beneath the horizontal line drawn and strives to break upward against the smaller moving average, eyeing a resistance point possibly below the line of the bigger moving average.
The 50-day SMA indicator’s trend line is below the 14-day SMA indicator, indicating that the current price depression mode is still in effect. The stochastic oscillators are overbought and show exhaustion signal values between 80.03 and 100.00. That implies that prospective purchasers could not observe a continuation of motion following rising motions.
Note: Cryptosignals.org is not a financial advisor. Do your research before investing your funds in any financial asset or presented product or event. We are not responsible for your investing results.
You can purchase Lucky Block here. Buy LBLOCK