ApeCoin (APE/USD) Bear Market Decelerates as Traders Initiate Accumulation Amid Price Decline
Estimated Reading Time: 3 minutes
Don’t invest unless you’re prepared to lose all the money you invest. This is a high-risk investment and you are unlikely to be protected if something goes wrong. Take 2 minutes to learn more
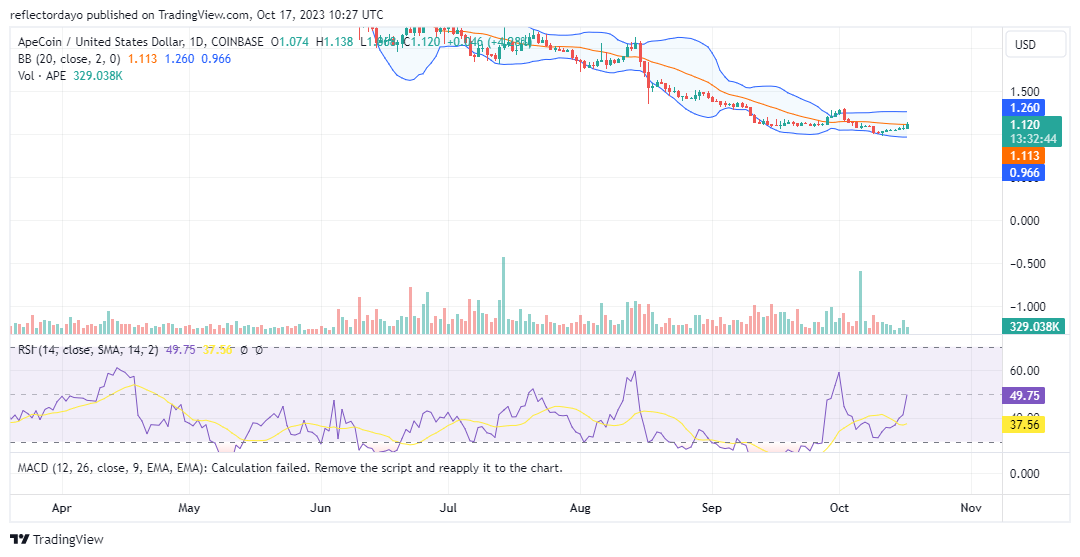
From a broader perspective, the ApeCoin market has exhibited a downward trajectory since reaching its annual peak of $6.406 in January. The bearish trend gained significant momentum in both February and June. Notably, between September and October, the market approached the critical $1.00 price level, and the bearish momentum began to wane. A cohort of bullish traders converged around this juncture, anticipating a potential rebound. However, contrary to expectations, the market consolidated at this price level and experienced modest upward movements during the late September to early October period.
The ApeCoin Market Data
- APE/USD Price Now: $1.260
- APE/USD Market Cap: $415,362,159
- APE/USD Circulating Supply: 368,593,750 APE
- APE/USD Total Supply: 1,000,000,000
- APE/USD CoinMarketCap Ranking: #79
Key Levels
- Resistance: $1.30, $1.40, and $1.50.
- Support: $1.00, $0.90, and $0.80.
ApeCoin Price Forecast: Insights from Key Indicators
The minor rebound observed in the ApeCoin market between late September and early October suggests a complex interplay of indecision and profit-taking activities. Some traders who entered the market in the first half of September appeared to lack the patience required for sustained gains, as uncertainty and hesitation appeared to trigger profit-taking, resulting in a subsequent downturn.
Nevertheless, there remains a prevailing bullish sentiment centered around the $1.00 price level. On October 6, a noteworthy development was the emergence of a significant bullish histogram in the volume of trade indicator, although the corresponding bullish candlestick for the day was less pronounced. This dual signal hints at lingering market indecision.
However, it’s worth noting that since the market touched the $1.00 price threshold on October 10, a distinct upward trend has taken shape. This trend reflects a shift in market dynamics and renewed optimism among traders.
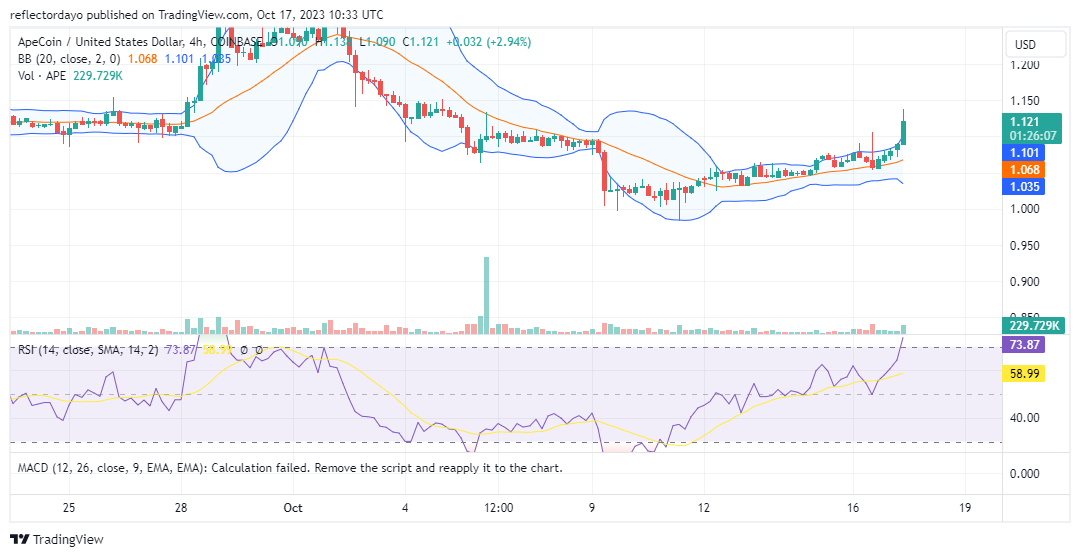
APE/USD 4-Hour Chart Outlook
When considering the 4-hour chart, the bull market appears to exhibit stability and consistent progress. In the most recent 4-hour trading session, the bulls successfully breached the significant $1.100 resistance level, marking this achievement with a pronounced bullish candlestick. The current objective for bullish investors is to establish a support level above this pivotal price point, thereby mitigating the potential for price retracement and maintaining the market’s position above the $1.100 price threshold.
This endeavor holds particular importance due to the substantial bullish momentum that has injected higher levels of volatility into the market. This heightened volatility could potentially empower bearish forces, making the need for securing this newfound support even more critical.