0x (ZRXUSD) Is Hot on the Trail of the $0.26 Price Level
Estimated Reading Time: 3 minutes
Don’t invest unless you’re prepared to lose all the money you invest. This is a high-risk investment and you are unlikely to be protected if something goes wrong. Take 2 minutes to learn more
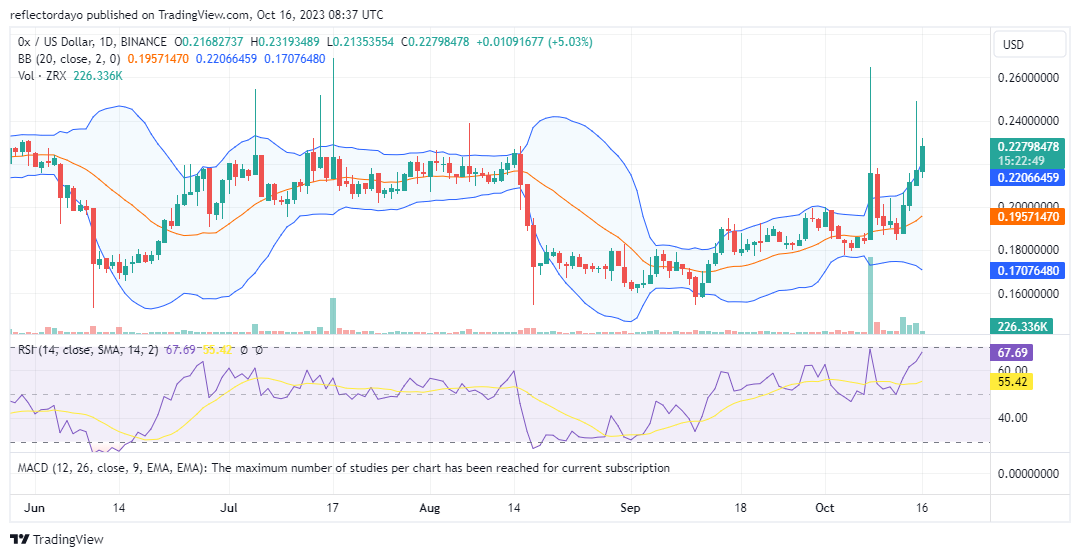
The 0x market has demonstrated resilience in maintaining its bullish momentum, even in the wake of a significant bearish trend that was initiated at the peak of $0.26. The bulls successfully managed to salvage the market by establishing a higher support level at $0.188 on October 13. Throughout the weekend, the market continued to display noteworthy bullish performance, propelling it into the $0.22 price range. This recent performance suggests that the market may still be targeting the $0.26 price level.
The 0x Market Data
- ZRX/USD Price Now: $0.2
- ZRX/USD Market Cap: $194,008,692
- ZRX/USD Circulating Supply: 847,496,055 ZRX
- ZRX/USD Total Supply: 1,000,000,000 ZRX
- ZRX/USD CoinMarketCap Ranking: #138
Key Levels
- Resistance: $0.23, $0.24, and $0.26.
- Support: $0.19, $0.18, and $0.17.
0x Price Forecast: Insights from Key Indicators
During the weekend, the 0x market witnessed significant bullish trends. Traders were able to capitalize on these bullish movements to secure profits, while the overall bullish sentiment remained intact, sustaining the upward trajectory of prices.
However, a cautious note arises when examining the market from the perspective of trade volume indicators. Despite the apparent significance of today’s bullish market activity, the accompanying trade volume histogram is notably small. In some cases, such a scenario might be interpreted as a potential weakening of the bullish momentum, hinting at a possible reversal. It’s important to consider that this could be a result of a limited number of large-scale traders, often referred to as ‘whales,’ attempting to influence and further catalyze the bullish market. If these influential entities continue to support the market in a bullish direction, it is likely that other traders will join the upward movement.
Furthermore, the Relative Strength Index (RSI) indicates that the RSI line is approaching the oversold region. This may dissuade traders from taking long positions, as they might anticipate an impending reversal. However, if the activities of these influential traders persist and keep the market overbought, it is possible that other traders will also participate in the bullish trend.
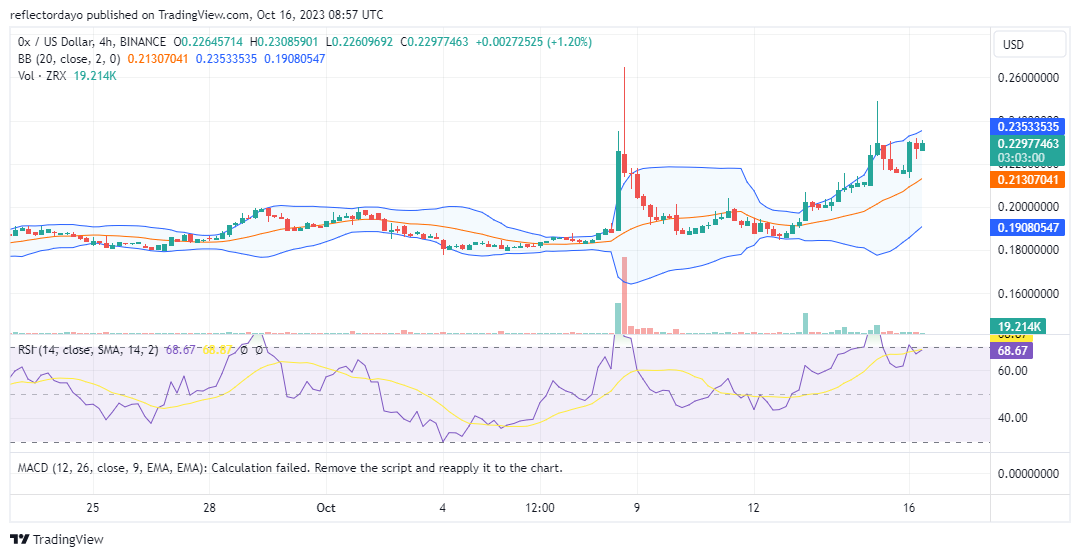
ZRX/USD 4-Hour Chart Outlook
Analyzing the 0x market from a shorter-term perspective reveals a potential explanation for the decrease in trading volume. It appears that the market has encountered a significant resistance level at $0.2300. The presence of a substantial number of sell orders at this price level has contributed to the reduction in trading volume, raising the possibility of a price reversal. This concentration of sell orders might dissuade traders from adopting long trading positions. Nevertheless, it is imperative to acknowledge the intricate nature of market dynamics, as numerous factors can impact price movements, including the resilience of the resistance level, broader market sentiment, and external news or events.