Optimistic Ascent of 0x (ZRXUSD) Amidst Bullish Momentum, Focused on the $0.26 Price Range
Estimated Reading Time: 3 minutes
Don’t invest unless you’re prepared to lose all the money you invest. This is a high-risk investment and you are unlikely to be protected if something goes wrong. Take 2 minutes to learn more
The 0x market’s bullish trend has been consistently underway since September, following a breakout from a consolidation phase near the $0.16 price level. Bulls encountered multiple resistance levels during this ascent. On October 8, a surge in liquidity fueled a test of the $0.26 price point. Such robust bullish movements are often unsustainable and can trigger significant bearish reversals, which subsequently led to a substantial retracement below the $0.20 mark. Despite this, the bull market seized the opportunity to establish a slightly higher support level.
The 0x Market Data
- ZRX/USD Price Now: $0.2009
- ZRX/USD Market Cap: $170,058,185
- ZRX/USD Circulating Supply: 52,455,790
- ZRX/USD Total Supply: 847,496,055 ZRX
- ZRX/USD CoinMarketCap Ranking: #138
Key Levels
- Resistance: $0.22, $0.23, and $0.24.
- Support: $0.19, $0.18, and $0.17.
Price Prediction for 0x: The Indicators’ Point of View
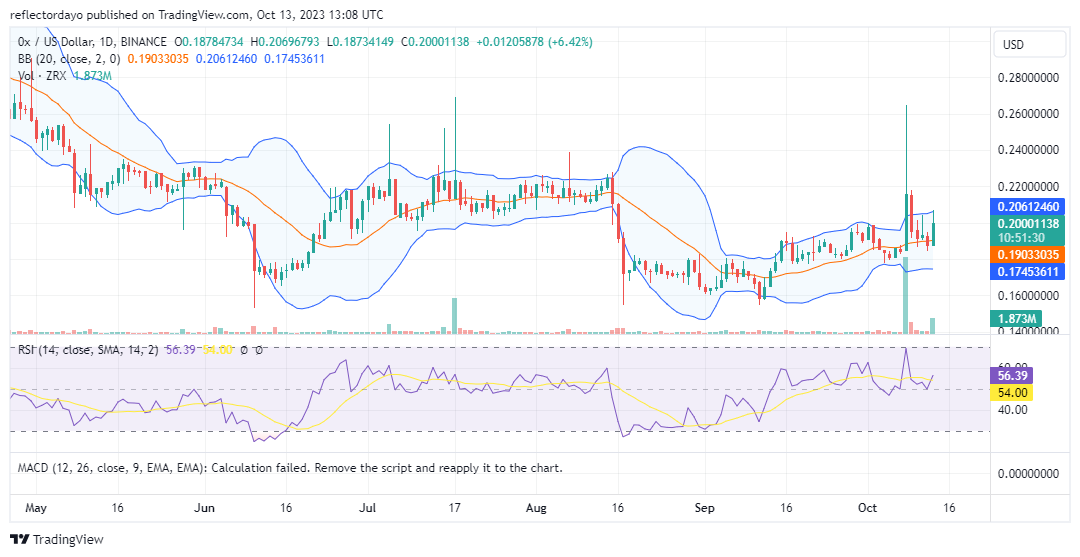
The 0x market experienced a significant decline, dropping sharply near the $0.16 price point in mid-August. Subsequently, the price has exhibited a period of consolidation around this level until a bullish breakout occurred. Prior to the bearish breakdown in mid-August, the price had been consolidating around $0.22.
The market’s activity displayed more swing lows than swing highs in the vicinity of the $0.22 price level, indicating a prevailing bearish sentiment, which eventually led to the downward breakout. Nevertheless, the market has shown resilience by testing the $0.26 price level since entering the consolidation phase at $0.22 in July.
Bulls remain determined to reach the $0.26 price level, and there is potential for upward momentum to facilitate this achievement. Notably, the chart reveals conspicuous spikes in the histogram, which can be interpreted as a possible precursor to a bullish price breakout. When considered alongside the market’s steady upward movement, this further bolsters the expectation of a potential bullish trend.
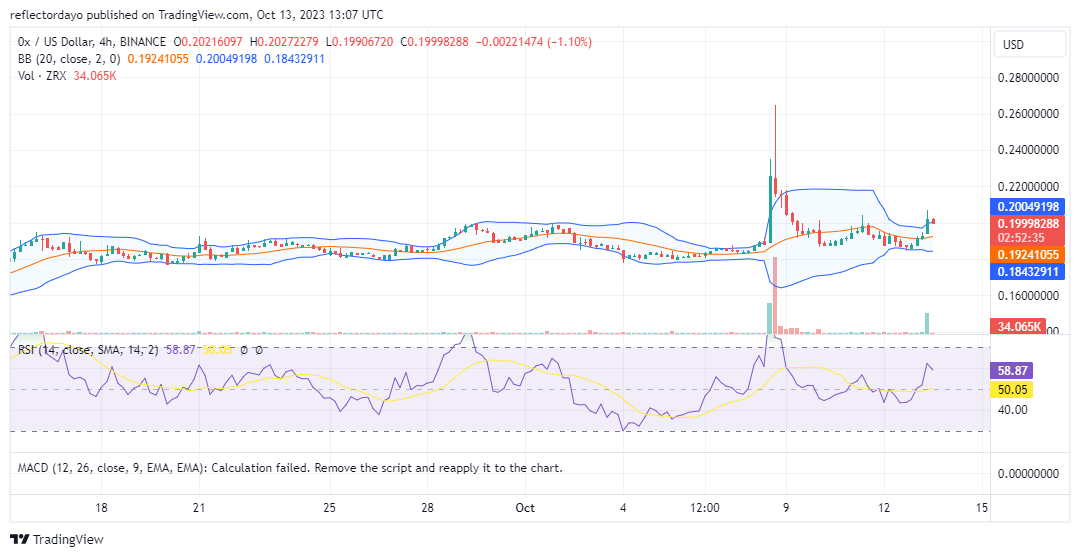
ZRX/USD 4-Hour Chart Outlook
Analyzing the market through the 4-hour chart, we observed a minor bullish breakout that appeared to be curtailed near the $0.20 price level. Presently, the trading volume is relatively low, suggesting the potential for the market to consolidate around this level with the intention of fortifying $0.20 as a support level. This consolidation phase could serve as a foundation for a subsequent upward price surge. The stability in trade volume might necessitate a consolidation period before a definitive price movement occurs.