Lucky Block Price Prediction: LBLOCK/USD Ready To Spike Above $0.0040
Estimated Reading Time: 2 minutes
Don’t invest unless you’re prepared to lose all the money you invest. This is a high-risk investment and you are unlikely to be protected if something goes wrong. Take 2 minutes to learn more

Free Crypto Signals Channel
The Lucky Block price prediction would rise and move towards the upper boundary of the channel as the bulls increase their momentum.
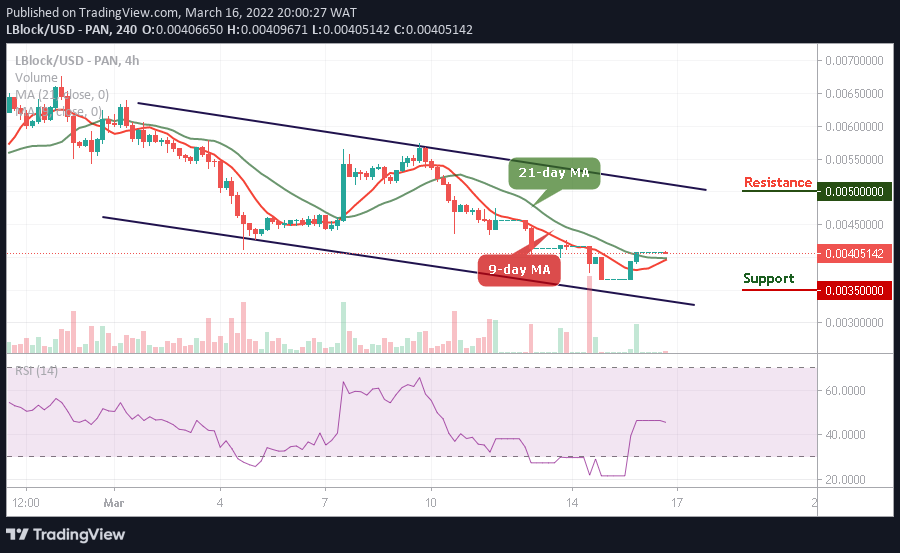
LBLOCK/USD Medium-term Trend: Bearish (4H Chart)
Key Levels:
Resistance levels: $0.0050, $0.0055, $0.0060
Support levels: $0.0035, $0.0030, $0.0025
LBLOCK/USD is ranging as the market price stays above the 9-day and 21-day moving averages. Meanwhile, the bullish momentum would push the coin towards the resistance level of $0.0045 as the coin gets ready for a spike to the upside.
Lucky Block Price Prediction: LBLOCK/USD Break to the Upside
The Lucky Block price is hovering at $0.0040 where it prepares to skyrocket towards the upper boundary of the channel. However, if the coin spike to the north, the coin would locate the potential resistance levels at $0.0050, $0.0055, and $0.0060, but any bearish movement to the south could hit the support levels at $0.0035, $0.0030, and $0.0025 which could allow more buyers to come into the market. The technical indicator Relative Strength Index (14) confirms the bullish movement.
LBLOCK/USD Medium-term Trend: Bearish (2H Chart)
Looking at the 2-hour chart, the Lucky Block price stays above the 9-day and 21-day moving averages with a tremendous bullish candle. However, the technical indicator Relative Strength Index (14) crosses into the overbought region to keep the coin at the upside. Meanwhile, any further bullish movement could hit the resistance level at $0.0050 and above.
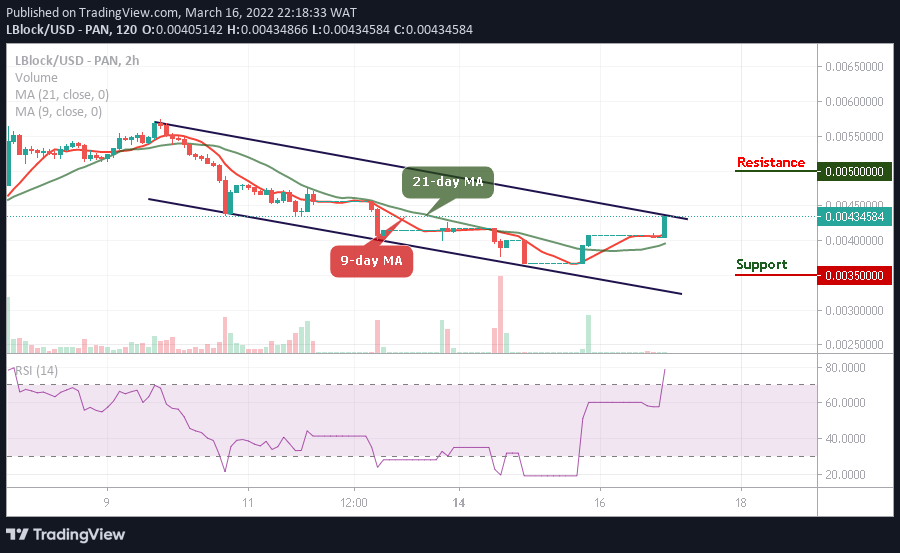
On the contrary, LBLOCK/USD will continue to experience more bullish signals, and the market price will spike to the upside, so this would be the best opportunity for the new buyers to come into the market. If the price drops below the market value at $0.0040, it could touch the critical support at $0.0035 and below as the new buyers should get ready to buy the dip.
Read more: