Bitcoin (BTC/USD) Market Trades Around $45,000
Estimated Reading Time: 3 minutes
Don’t invest unless you’re prepared to lose all the money you invest. This is a high-risk investment and you are unlikely to be protected if something goes wrong. Take 2 minutes to learn more
Bitcoin Price Prediction – September 12
There have been appearances of price movement at the $45,000 level as the BTC/USD market trades around it. The crypto price witnesses a positive percentage rate of about 1.52, trading at a capacity level of about $46,246 as of writing. That is a promissory sign that the market possesses a hidden catalyst to shoot up possibly in no time.
BTC/USD Market
Key Levels:
Resistance levels: $50,000, $52,500, $55,000
Support levels: $45,000, $42,500, $40,000
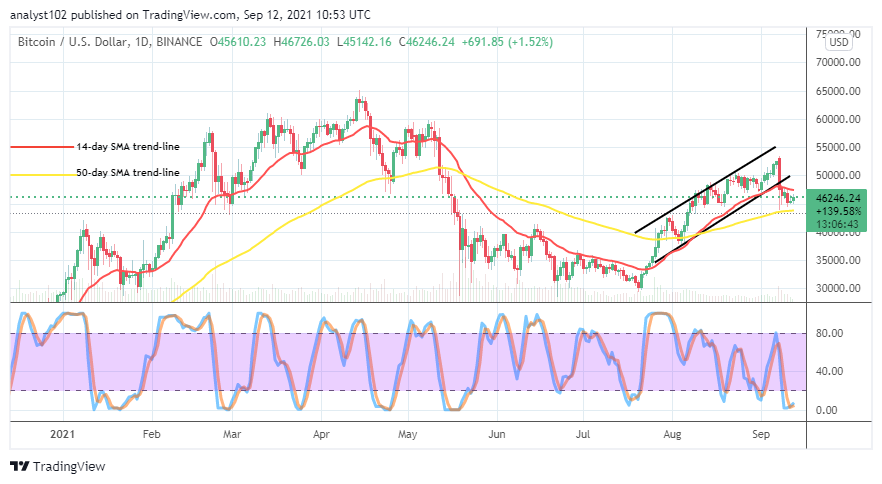
BTC/USD – Daily Chart
The BTC/USD daily chart pictures that the crypto market trades around $45,000 with some technicalities of supports building outlook. The bigger SMA trend-line yet found, playing a critical supportive role to the market a bit beneath the value line. The 14-day SMA indicator is above the 50-day SMA indicator. And, the bullish channel trend lines are left drawn on the chart to keep the paths that price witnessed during the upside variant motions. The Stochastic Oscillators are freshly present in the oversold region. And, they have closed the lines in an attempt to spring northbound.
Will there be a heightening of downward forces against the line of $45,000 as the market trades around it?
Heightening of downward forces at the line of $45,000 may not in the long-term be in favor of further downsizing of the BTC/USD price valuation. As the crypto market trades around the value-line mentioned earlier, bulls have been making series of efforts to regain grand. A violent sudden breaking down of the line may invalidate the assumption.
The presumed violent-sudden breakdown of the $45,000 level may give the probability of the market getting back into a bearish trend. In the meantime, that scenario may not come to past in the near trading days’ sessions. The market appears to face resistances between $47,500 and around $50,000 points in following operations. While that happens, short-position traders will have to look out for decent sell entry to launch their presence.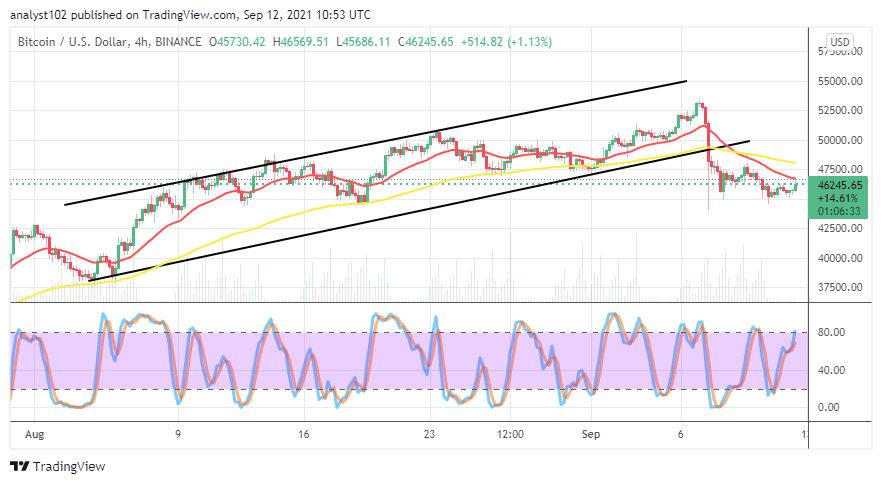
BTC/USD 4-hour Chart
The BCT/USD 4-hour chart showcases that the crypto market trades around $45,000, making an effort to increase pressures to the upside. The 14-day SMA trend line stays below the 50-day SMA trend line as $47,500 appears to be the resistance line that price will encounter if the pressures will have to get heightened northward further. The Stochastic Oscillators have sprung upward close range 80, briefly pointing to the north side. It also seems that the buying pressures are slowing down the pushing rate pace. Thereby, traders needed to be wary of exerting a position at this point.
Note: Cryptosignals.org is not a financial advisor. Do your research before investing your funds in any financial asset or presented product or event. We are not responsible for your investing results.
You can purchase crypto coins here. Buy Tokens