Ethereum Is Drifting Sideways below Its Peak of $1.300
Estimated Reading Time: 2 minutes
Don’t invest unless you’re prepared to lose all the money you invest. This is a high-risk investment and you are unlikely to be protected if something goes wrong. Take 2 minutes to learn more
Ethereum Price Long-Term Analysis: Bearish
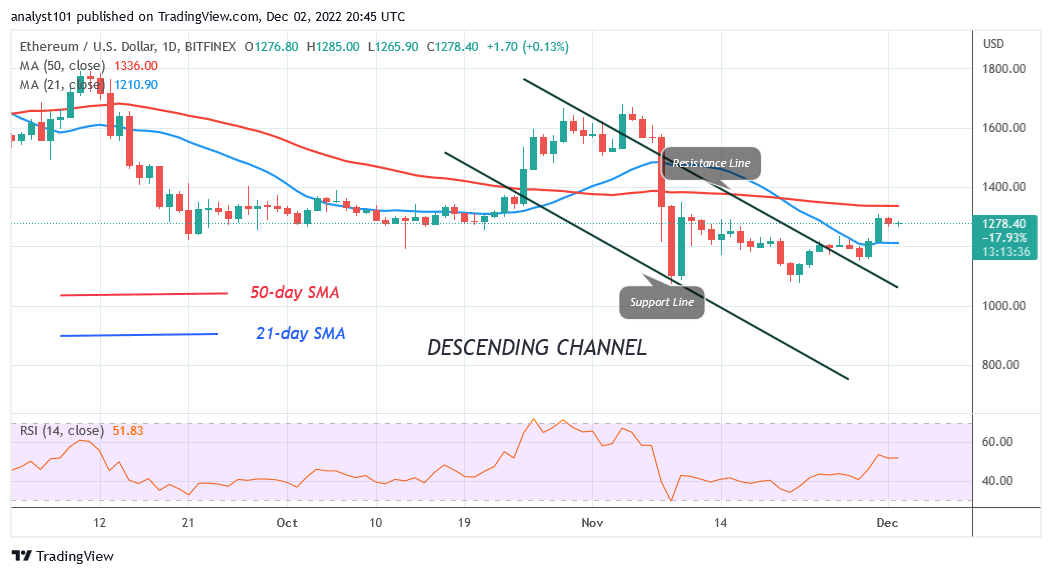
Ethereum (ETH) price trades between $1,200 and $1,300 but below its peak of $1.300. Ether is also constrained by the moving average lines. The bottom line is that whenever the moving average lines are crossed, Ether will trend. For instance, Ether will go over the 50-day line SMA if the $1,300 high is broken. Ether will rise to a high of $1,600 on the upside if buyers maintain the positive momentum above the 50-day line SMA. On the other hand, the downtrend will continue if the bears once more breach below the 21-day line SMA. The altcoin will fall and return to the $1,100 support.
Ethereum Indicator Analysis
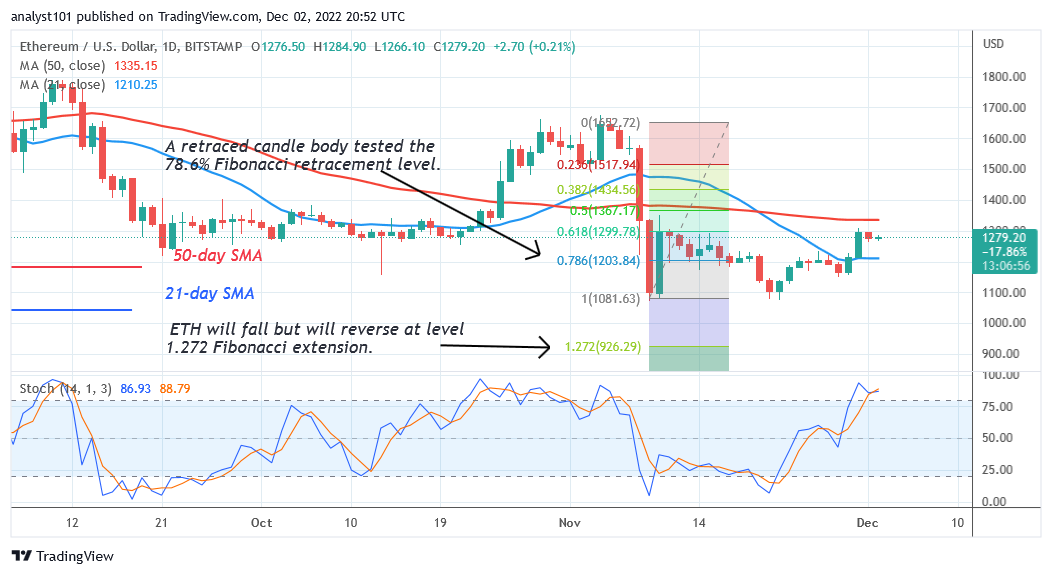
Ethereum has risen to level 53 on the Relative Strength Index for period 14. Ether is in an uptrend, but the $1,300 high prevents it from moving much higher. Price bars are between moving average lines which indicate that the coin will move in a range. Ether is moving upward over the daily Stochastic threshold of 70.
Technical indicators:
Major Resistance Levels – $2, 600, $2,800, $3,000
MajorSupport Levels – $1.500, $1, 300, $1,100
What Is the Next Direction for Ethereum?
Ethereum is stuck at its most recent peak but below its peak of $1.300. For a few more days, the crypto is most likely to remain range-bound. The price has been sliding slowly but consistently below the resistance level.
You can crypto coins here. Buy LBLOCK
Note: Cryptosignals.org is not a financial advisor. Do your research before investing your funds in any financial asset or presented product or event. We are not responsible for your investing results