SPONGE/USD ($SPONGE): Anticipating a Possible Reversal Around $0.00010
Estimated Reading Time: 2 minutes
Don’t invest unless you’re prepared to lose all the money you invest. This is a high-risk investment and you are unlikely to be protected if something goes wrong. Take 2 minutes to learn more
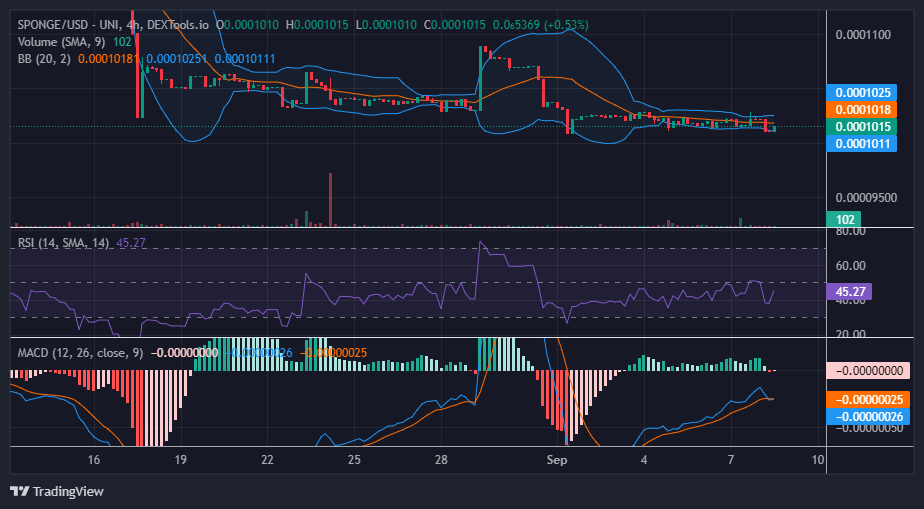
SPONGE/USD has been in a prolonged consolidation phase, maintaining its price around the $0.0001030 mark. Recent market developments have captured the attention of traders and analysts alike. Towards the end of August, a significant bull run surged, pushing the market to a peak at $0.000109. This rally sparked notable buying interest and instilled a positive sentiment among market participants.
Following this peak, the market retraced to the $0.0001030 level in the early days of September. This correction is considered a natural response after a strong bullish upswing.
Key Levels
- Resistance: $0.000115, $0.000120, and $0.000125.
- Support: $0.00010, $0.000090, and $0.00008.
Sponge (SPONGE/USD) Price Analysis: The Indicators’ Point of View
While it seems that bearish pressure has caused a minor shift in the support level of SPONGE/USD from $0.0001030 to $0.0001022, there are indications suggesting a potential imminent breakout. The Relative Strength Index (RSI) is approaching the 50 level, which acts as a midpoint indicator. Additionally, the MACD lines are nearing a crossover above the zero level, hinting at a potential divergence. These developments could provide strong signals for considering a long trade.
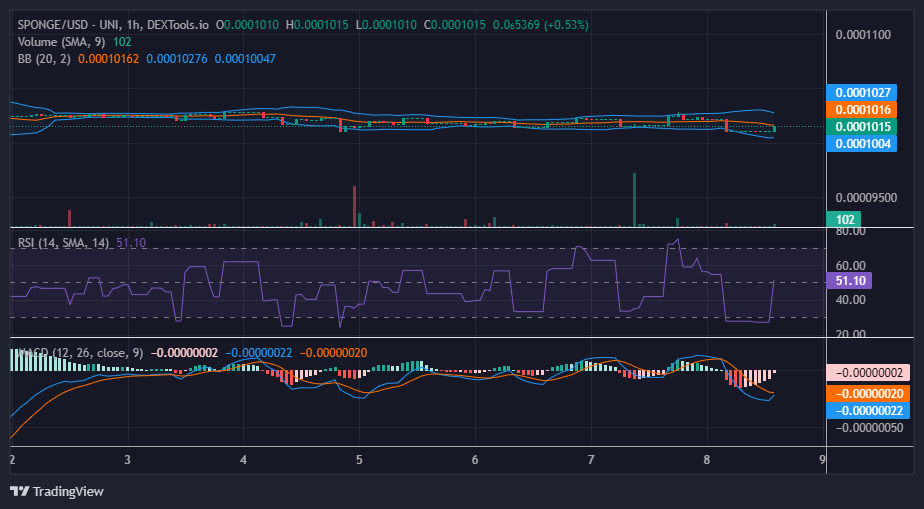
$SPONGE Short-Term Outlook: 1-Hour Chart
In the recent daily trading session, a significant increase in trading volume was noted during one of the 1-hour sessions, although it did not notably affect the candlestick formation. This occurrence can be interpreted as a positive sign, indicating growing bullish interest. However, the ongoing struggle continues into today’s trading session. Buyers may hold an advantage in the potential breakout, given the convergence happening within bullish territory.
Buy the SPONGE/USD and soak up the damp.
#NFT holders when they’re trying to explain what they do in #Crypto…🗣️🤣 pic.twitter.com/vcSKsPiQTE
— $SPONGE (@spongeoneth) September 8, 2023
Invest in the hottest and best meme coin. Buy Sponge ($SPONGE) today!