Cardano’s Price Halts at $0.30 as It Resumes Its Horizontal Trend
Estimated Reading Time: 2 minutes
Don’t invest unless you’re prepared to lose all the money you invest. This is a high-risk investment and you are unlikely to be protected if something goes wrong. Take 2 minutes to learn more
Cardano (ADA) Price Long-Term Forecast: Bearish
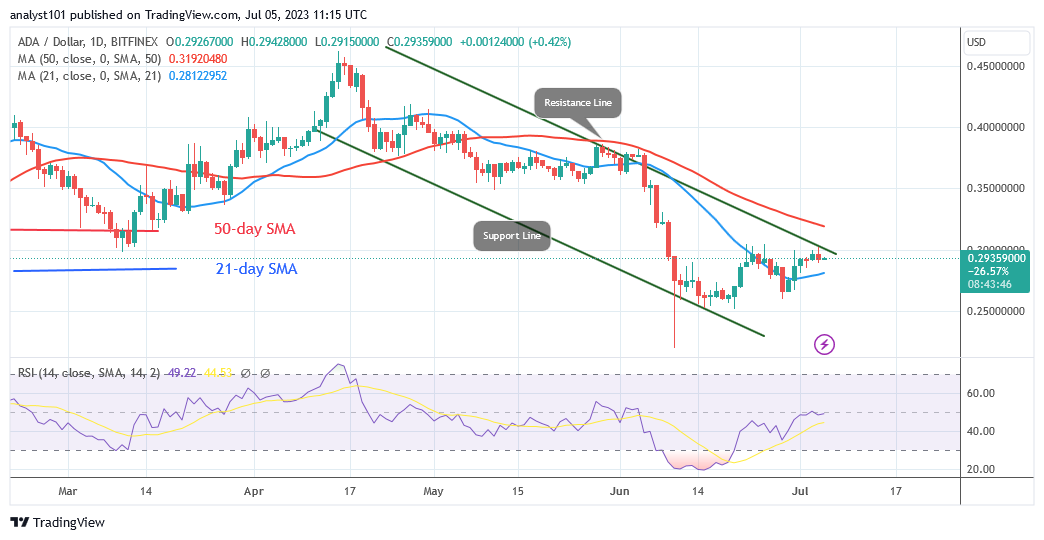
Cardano (ADA) is on an upward correction as it resumes its horizontal trend. The bullish momentum was halted twice at $0.30 barrier. ADA is now trading between the moving average lines. The crypto’s price is higher than the 21-day SMA but lower than the 50-day SMA. Cardano will resume positive momentum if the price breaks above the $0.30 resistance and the 50-day simple moving average.
The altcoin is expected to surge to prior highs of $0.38 and $0.46. If the altcoin is rejected at the recent high, it will fall to the prior low of $0.25. Meanwhile, Cardano is caught between the moving average lines.
Technical Indicators:
Major supply zones: $1.0, $1.05, $1.10
Major demand zones: $0.45, $0.40, $0.35
Cardano (ADA) Indicator Analysis
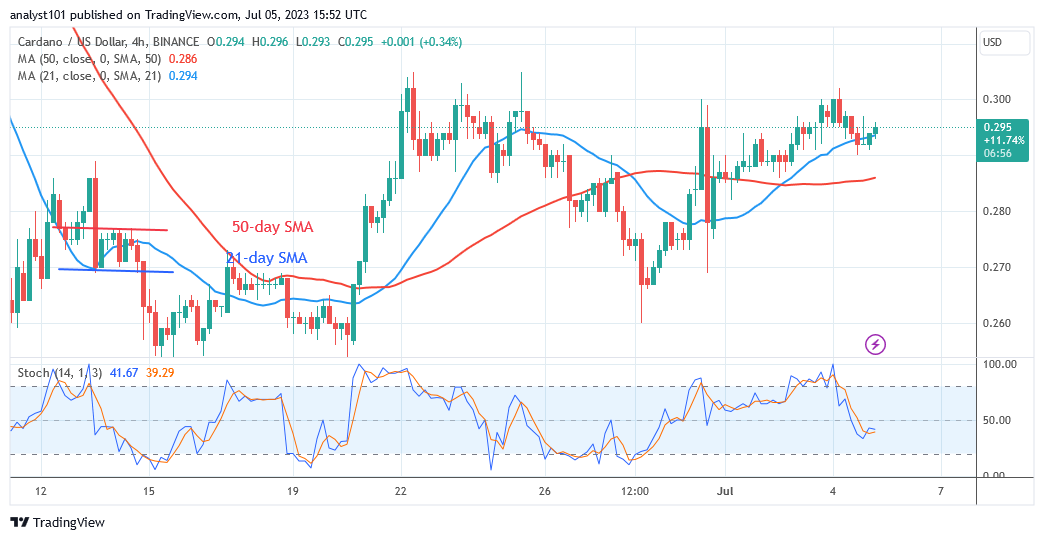
Cardano is at Relative Strength Index level 49 for period 14. The cryptocurrency asset has attained its price equilibrium. That is, demand and supply are in equilibrium. However, Cardano’s range-bound behavior might persist given that it is pinned within the moving average lines. The bearish momentum has stalled below the daily Stochastic level of 50.
What Is the Next Move for Cardano (ADA)?
Cardano has made gains but is stuck between the moving average lines as it resumes its horizontal trend. Positive movements have been halted twice at the $0.30 resistance level. As it faces rejection at a recent high, the altcoin will continue to trend sideways. When the moving average lines are broken, the altcoin will trend.
You can purchase crypto coins here. Buy LBLOCK
Note: Cryptosignals.org is not a financial advisor. Do your research before investing your funds in any financial asset or presented product or event. We are not responsible for your investing results