SPONGE/USD ($SPONGE): Awaiting a Potential Reversal at $0.00010
Estimated Reading Time: 3 minutes
Don’t invest unless you’re prepared to lose all the money you invest. This is a high-risk investment and you are unlikely to be protected if something goes wrong. Take 2 minutes to learn more
In the SPONGE/USD market, the $0.00010 price level has consistently acted as a vital support level, historically attracting buyers and preventing further price declines.
With the SPONG/USD market showing prolonged sideways movement, there is a growing probability of an impending price rally originating from this critical support level. To anticipate a potential bullish trend, traders and analysts should diligently monitor price action, especially focusing on signs of the price crossing above the 20-day moving average and breaking through the upper standard deviation curve.
Key Levels:
- Resistance: $0.000115, $0.000120, and $0.000125.
- Support: $0.00010, $0.000090, and $0.00008.
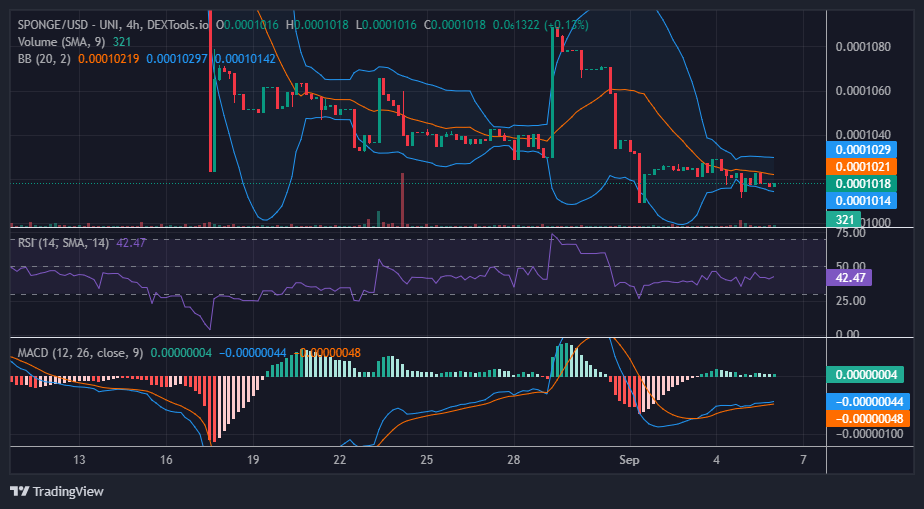
Sponge (SPONGE/USD): Insights from Indicators
Currently, the Bollinger Bands are converging near the $0.00010 price level, suggesting reduced price volatility and hinting at an imminent breakout or significant price movement. However, it’s important to note that the Relative Strength Index (RSI) remains below 50, indicating the prevailing bearish sentiment and ongoing selling pressure, with limited signs of strong bullish momentum.
Furthermore, both the upper and lower standard deviations of the Bollinger Bands are converging, forming an exceptionally narrow price channel. This narrow range signifies a market in consolidation or indecision.
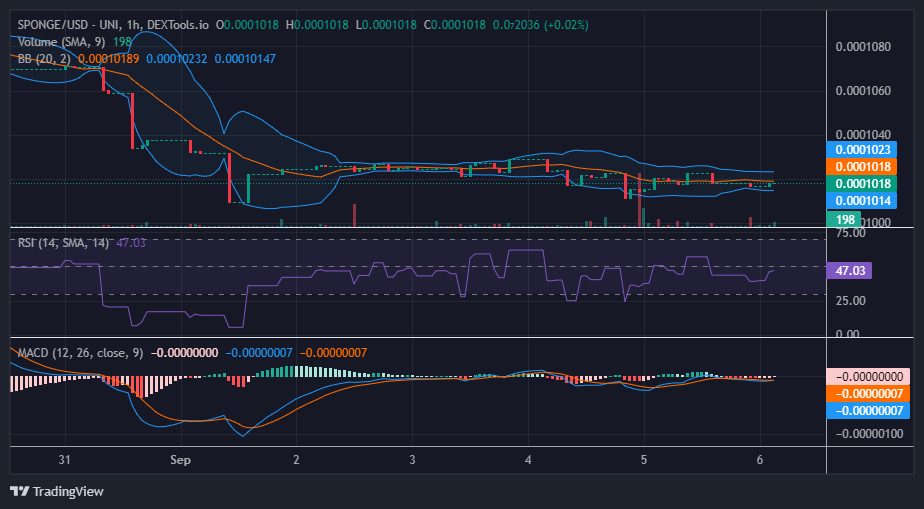
$SPONGE Short-Term Outlook: 1-Hour Chart
Considering the technical analysis and the significance of the key support level at $0.00010, there exists a potential opportunity for a rebound in the SPONGE/USD market. Traders and investors may find the $0.00010 level attractive, given its historical significance in attracting buying interest and its potential to initiate an upward price movement.
It is advisable for traders to maintain a vigilant watch on the Bollinger Bands, particularly for any signs of a breakout. A breakout from the narrow channel formed by the converging Bollinger Bands could indicate the beginning of a new trend direction, providing traders with valuable insights for their strategies.
Buy SPONGE/USD now!
Looking forward to that #Bullrun one day… 📈🚀🥸 pic.twitter.com/sPC7CU1wMS
— $SPONGE (@spongeoneth) September 6, 2023
Invest in the hottest and best meme coin. Buy Sponge ($SPONGE) today!