SPONGE/USD ($SPONGE) Prepares to Rally From the $0.0001030 Price Level
Estimated Reading Time: 2 minutes
Don’t invest unless you’re prepared to lose all the money you invest. This is a high-risk investment and you are unlikely to be protected if something goes wrong. Take 2 minutes to learn more
On August 29, there was a notable bullish move in the market that pushed the price from $0.0001030 to $0.0001091 within a single session. This sudden surge was characterized by a marubozu candlestick, indicating strong buying pressure. However, it’s worth noting that this move lacked sustained bullish momentum. Following the $SPONGE bullish move, the market experienced a reversal, with bearish sentiment taking over. This pushed the price back down to the key support level of $0.0001030.
Key Levels
- Resistance: $0.000115, $0.000120, and $0.000125.
- Support: $0.00010, $0.000090, and $0.00008.
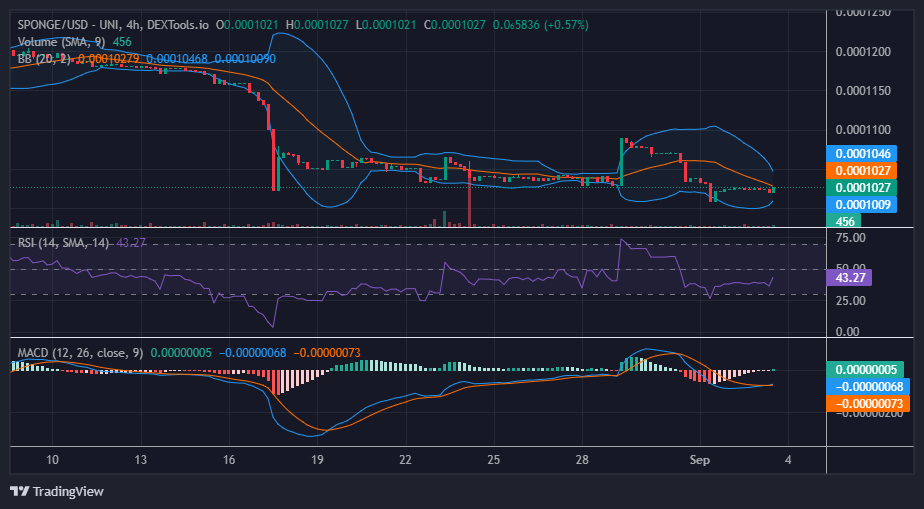
Sponge (SPONGE/USD) Price Analysis: The Indicators’ Point of View
Currently, the $0.00010 level remains the last line of defense for $SPONGE. If this level fails to hold, it could signify further downside potential and a continuation of the bearish trend.
The Relative Strength Index (RSI) is currently at 43. The RSI at this level suggests that the market is in a neutral state, neither overbought nor oversold. The Moving Average Convergence and Divergence (MACD) indicator shows that the two lines have merged together and are ranging sideways below the zero level. This consolidation, for now, suggests a lack of clear trend direction in the short term.
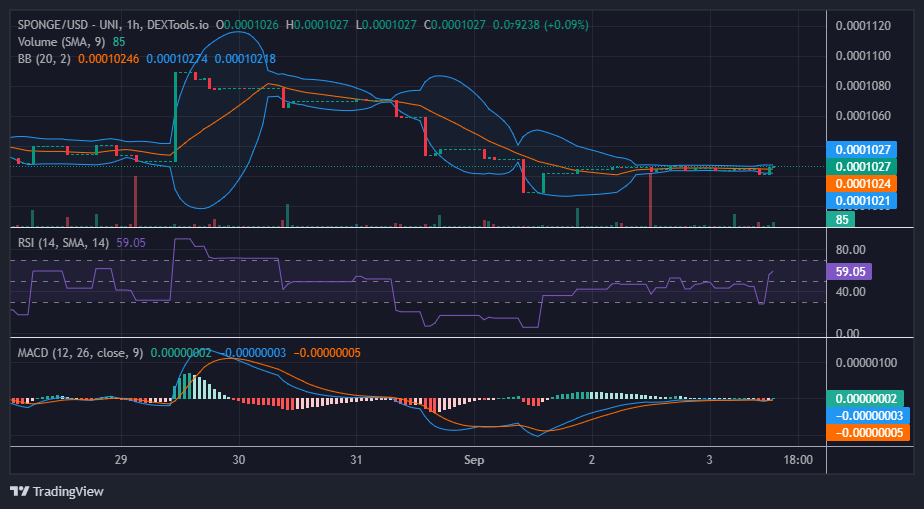
$SPONGE Short-Term Outlook: 1-Hour Chart
On the 1-hour chart analysis of the $SPONGE market, we observed a notable increase in trading volume on September 1. However, there were no significant changes in the candlestick pattern’s outlook. Given this market dynamic, there is a possibility of an impending bullish price breakout. It is likely that the upcoming week could set the market on an upward trajectory.
Get ready for the exciting $SPONGE Airdrop journey.
🌟Hello #SPONGERS!👋
🎉Prepare for the thrilling $SPONGE #Airdrop adventure!🚀🎁
🌟Make sure you meet the criteria on our #Discord to qualify!✅
🧽Explore the airdrop-signup instructions for comprehensive information!📋💸
🔗https://t.co/lzRhjW4oLL pic.twitter.com/hWZvZTkIT2
— $SPONGE (@spongeoneth) September 3, 2023
Invest in the hottest and best meme coin. Buy Sponge ($SPONGE) today!