SPONGE/USD ($SPONGE): Bulls Regroup at the Equilibrium Price
Estimated Reading Time: 3 minutes
Don’t invest unless you’re prepared to lose all the money you invest. This is a high-risk investment and you are unlikely to be protected if something goes wrong. Take 2 minutes to learn more
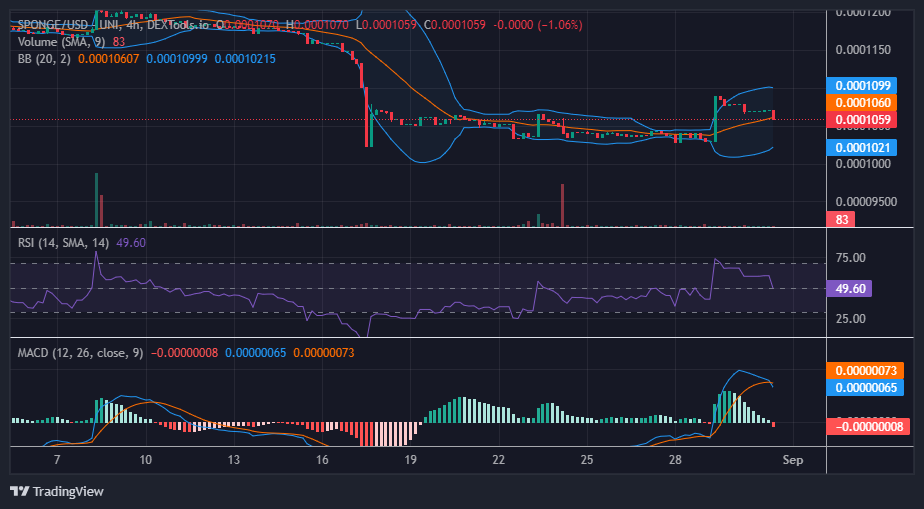
The recent price action of $SPONGE has shown encouraging signs that could shape the market’s direction in the near term. On August 29, the market experienced a robust and impressive bullish move. Notably, the third 4-hour session of that day formed a marubozu candlestick pattern, underscoring the strength of the uptrend. This pattern signifies that the buying pressure was consistently strong throughout the session.
However, it’s worth noting that the volume of trade during that session was not as substantial as one might expect to support such a vigorous and decisive candlestick. This discrepancy between the candlestick’s boldness and the trading volume suggests a cautious approach, indicating that the bullish momentum might not be as enduring as initially assumed.
Key Levels
- Resistance: $0.000115, $0.000120, and $0.000125.
- Support: $0.00010, $0.000090, and $0.00008.
Sponge (SPONGE/USD) Price Analysis: The Indicators’ Point of View
Since reaching its recent high, the $SPONGE market has displayed a controlled retracement, demonstrating a healthy adjustment after the rapid ascent. The bearish phase has brought the price down to $0.000106, indicating a retracement without significant panic selling. This measured retracement could be interpreted as a potential consolidation before the next move.
Both the Bollinger Bands indicator and the Relative Strength Index (RSI) lend valuable insights to the market’s equilibrium. The Bollinger Bands, which widen during periods of volatility and narrow during calmer phases, are currently suggesting a return to stability. Likewise, the RSI’s positioning reaffirms this equilibrium, reflecting a balanced interaction between buying and selling pressures.
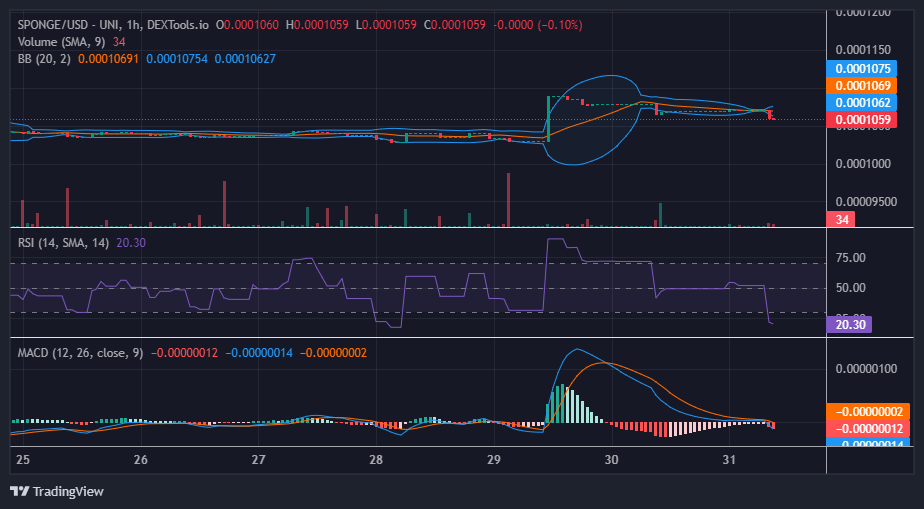
$SPONGE Short-Term Outlook: 1-Hour Chart
Looking ahead, an optimistic perspective emerges if bulls can successfully establish a robust support level at the current price. Doing so would not only demonstrate resilience but also position the market favorably for potential further advancement. The immediate target of $0.00011 for the bullish trend appears achievable if the support holds, potentially paving the way for renewed buying interest.
The SPONGE/USD airdrop is still ongoing.
🪂Don’t miss out on your chance to engage in the $SPONGE #Airdrop!
🎈Enroll today for a shot at incredible incentives
✨Hop into our #Discord server and verify
📋Find the airdrop-registration segment
🔐Fill out the form and link up your accountshttps://t.co/lzRhjW4WBj pic.twitter.com/JJd4GngFAn
— $SPONGE (@spongeoneth) August 31, 2023
Invest in the hottest and best meme coin. Buy Sponge ($SPONGE) today!