XRP Resumes Its Recovery as It Holds above $0.46
Estimated Reading Time: 2 minutes
Don’t invest unless you’re prepared to lose all the money you invest. This is a high-risk investment and you are unlikely to be protected if something goes wrong. Take 2 minutes to learn more
XRP (XRP) Long-Term Analysis: Bearish
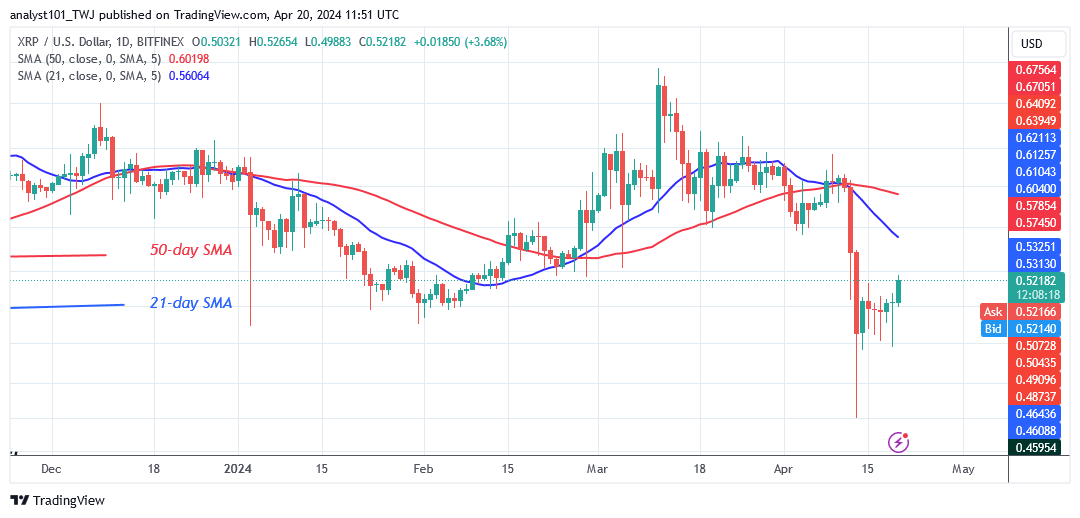
The XRP (XRP) price has fallen below the moving average lines as it resumes its recovery above $0.46. Bulls purchase on dips as the altcoin recovers above the $0.46 support level. The present support level of $0.46 holds as the cryptocurrency rallies to previous highs. On the upside, the altcoin may encounter resistance at $0.61 or the moving average lines.
If XRP fails to climb above the moving average lines, the altcoin will be forced to trade in a range between $0.46 to $0.61 price levels. On the upside, if buyers maintain the price above the moving average lines, XRP will resume its bullish trend. The coin will reach its prior high of $0.74. Meanwhile, the altcoin is continuing to trade in the bearish trend zone.
Technical Indicators:
Major Resistance Levels – $1.00, $1.50, $2.00
Major Support Levels – $0.50, $0.30, $0.10
XRP (XRP) Indicator Analysis
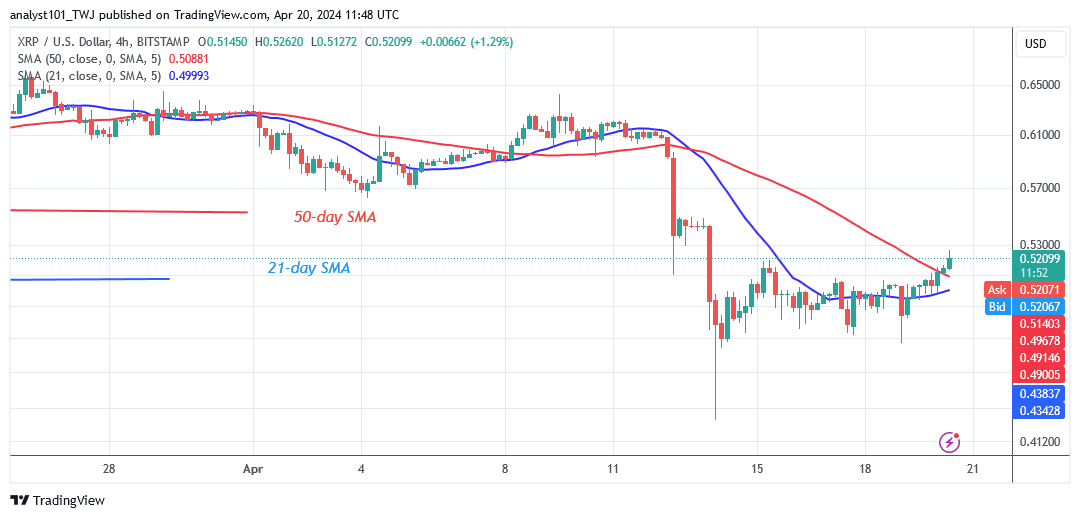
On the 4-hour chart, the price bars are above the moving averages. The altcoin is growing, but it confronts rejection at a high of $0.53. The moving average lines are trending southward, indicating a bearish crossover. The slide has slowed above the $0.46 support, indicating a protracted candlestick tail. On April 13, 2024, the long candlestick shows significant buying pressure at the $0.41 support.
What Is the Next Direction for XRP (XRP)?
The cryptocurrency has begun a range-bound rise as it resumes its recovery above $0.46. On the 4-hour chart, the altcoin’s price ranges from $0.47 to $0.53. Currently, the upward corrective is being rebuffed at a high of $0.53. In the meanwhile, the crypto signal range is limited to its present range.
You can purchase crypto coins here. Buy LBLOCK
Note: Cryptosignals.org is not a financial advisor. Do your research before investing your funds in any financial asset or presented product or event. We are not responsible for your investing results