Bitcoin Cash (BCH/USD) Price Heavily Goes Dumping
Estimated Reading Time: 3 minutes
Don’t invest unless you’re prepared to lose all the money you invest. This is a high-risk investment and you are unlikely to be protected if something goes wrong. Take 2 minutes to learn more

Free Crypto Signals Channel
Bitcoin Cash Price Prediction – May 13
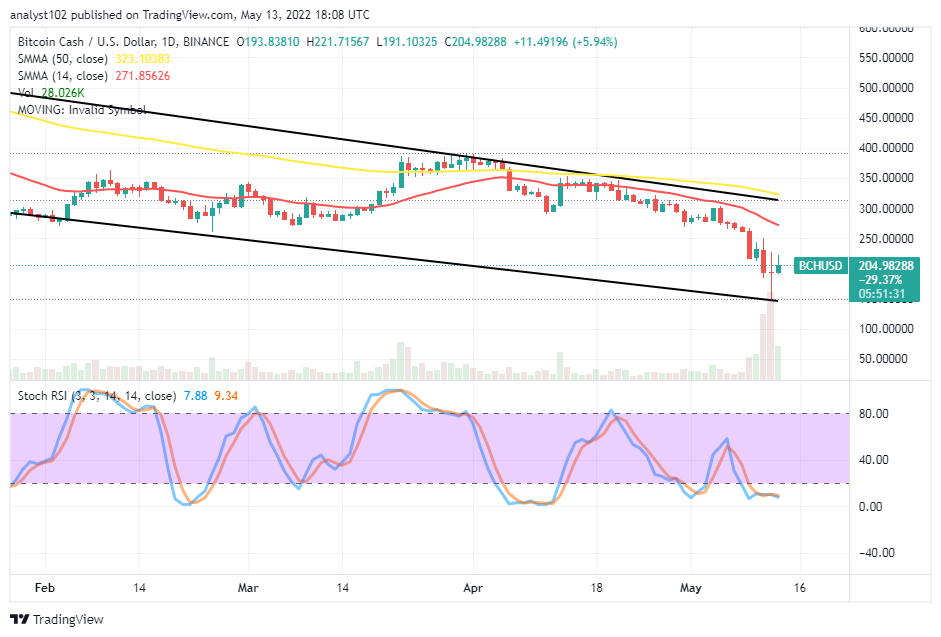
The Bitcoin Cash price heavily goes dumping against the valuing weight of the US Dollar over some sessions recently. New lower-trading zones have now been set between $221 and $191 as the market maintains a positive percentage rate 0f 5.94.
BCH/USD Market
Key Levels:
Resistance levels: $250, $300, $350
Support levels: $150, $100, $50
BCH/USD – Daily Chart
The BCH/USD daily chart reveals the crypto-economic price heavily goes dumping to set fresh new lower-trading spot within the confinement of the bearish channel trend lines drew. The 14-day SMA indicator is underneath the 50-day SMA indicator. The Stochastic Oscillators are in the oversold region, moving in a line of short-consolidation moving mode to signify that price is maintaining a sign of pausing currently.
Will the BCH market falls more, pairing with the US Dollar?
The method style that the BCH/USD used to down to touch a lower point around the $150 support level yesterday denoted the crypto business has found a baseline. As it is observed that the BCH/USD price heavily goes dumping in valuation over a couple of trading sessions, a bullish candlestick has occurred presently. And, it shows a sign of top show around $200 line to signal the possibility of getting some lows beneath the value line in the subsequent sessions.
On the downside, the BCH/USD market short-position takers may be consolidating efforts around the $200 point to push back down the crypto economy value. However, variant rebounding motions can feature while price attempts to make a sudden false fall to an average of the $150 support level. The main resistant point is around the trend line of the 14-day SMA around the $250 resistance.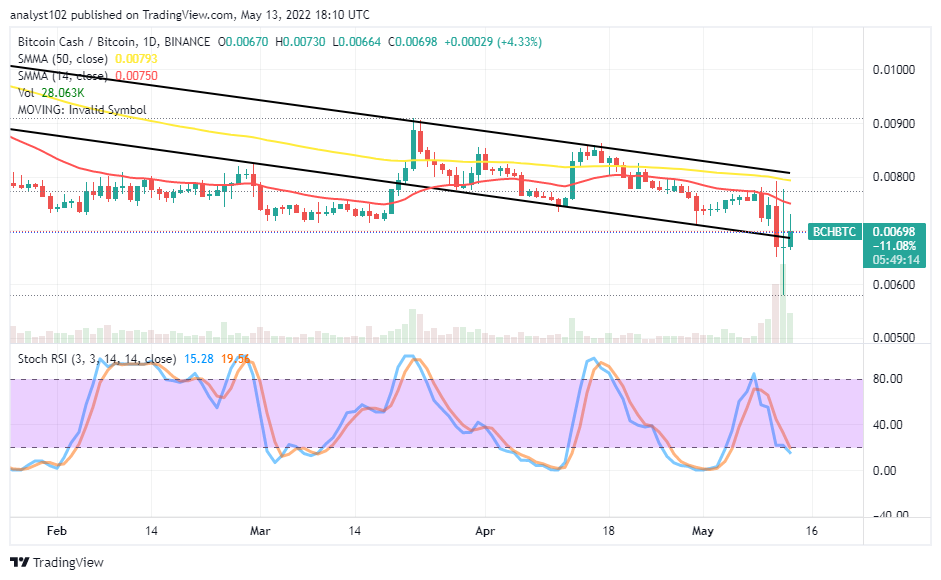
BCH/BTC Price Analysis
Bitcoin Cash’s pushing capacity against Bitcoin has been witnessing downing motions. The cryptocurrency pair price heavily goes dumping in its valuation. The 14-day SMA indicator is underneath the 50-day SMA indicator within the bearish channels. The Stochastic Oscillators have moved southbound from the range of 80 to position around the range of 20, lightly dipped into the oversold to indicate the base crypto is yet to regain its lost momentum as traded against the counter crypto.
Note: Cryptosignals.org is not a financial advisor. Do your research before investing your funds in any financial asset or presented product or event. We are not responsible for your investing results.
You can purchase Lucky Block here. Buy LBlock:


