Polkadot Battles the Resistance at $23, Targets $28 High
Estimated Reading Time: 2 minutes
Don’t invest unless you’re prepared to lose all the money you invest. This is a high-risk investment and you are unlikely to be protected if something goes wrong. Take 2 minutes to learn more

Free Crypto Signals Channel
Polkadot (DOT) Long-Term Analysis: Bullish
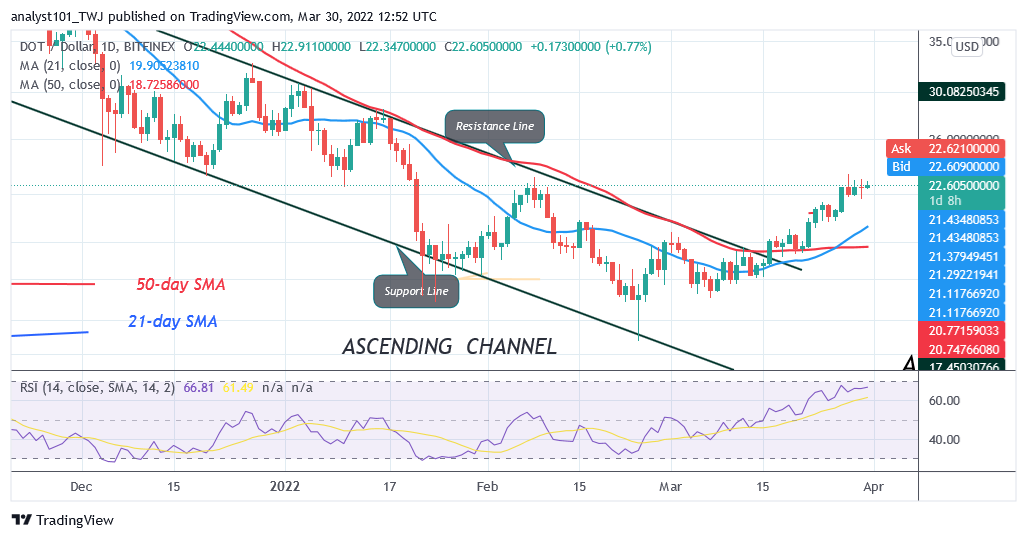
Polkadot’s (DOT) price has continued its bullish run but targets $28 high. Since March 28, buyers have been making frantic efforts to break the recent high. On the upside, a break above the recent high will propel the altcoin to rally above the high of $28. Presently, the cryptocurrency is trading in the overbought region of the market. The current uptrend may be affected. On the downside, the market may decline above the moving averages or $18 if the altcoin turns from the resistance zone.
Polkadot (DOT) Indicator Analysis
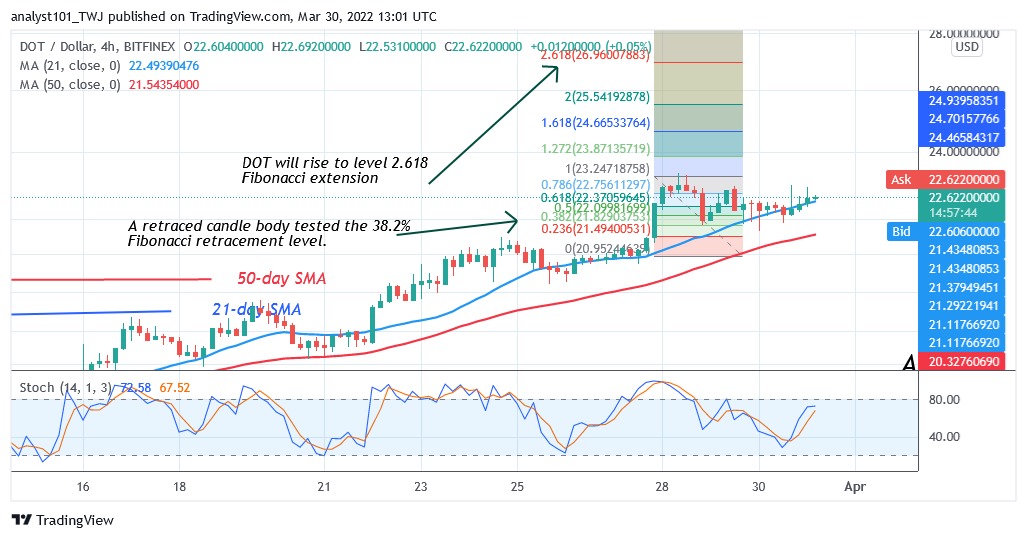
DOT price is at level 67 of the Relative Strength Index period 14. The crypto will reach the overbought region at level 70. The altcoin will continue to rise to the previous high. DOT price has a bullish crossover. The 21-day line SMA crosses above the 50-day line SMA indicating a buy order. The altcoin is above the 70% range of the daily stochastic. The altcoin is in a bullish momentum. DOT’s price is above the 50-day line SMA and the 21-day line SMA indicating the uptrend.
Technical indicators:
Major Resistance Levels – $48, $52, $56
Major Support Levels – $32, $28, $24
What Is the Next Direction for Polkadot (DOT)?
DOT/USD has continued its upward move at it targets $28 high. However, for the past four days, buyers have not been able to break the resistance at $23. The altcoin will rally to the upside when the resistance is breached. Meanwhile, on March 28 uptrend; a retraced candle body tested the 38.2% Fibonacci retracement level. The retracement suggests that DOT will rise to level 2.618 Fibonacci extension or level $26.96.
You can purchase crypto coins here. Buy LBlock
Note: Cryptosignals.org is not a 1a financial advisor. Do your research before investing your funds in any financial asset or presented product or event. We are not responsible for your investing results