Cardano (ADA/USD) Bulls Rally, Momentum Slows as Price Approaches $1.110
Estimated Reading Time: 3 minutes
Don’t invest unless you’re prepared to lose all the money you invest. This is a high-risk investment and you are unlikely to be protected if something goes wrong. Take 2 minutes to learn more
The $1.110 price level is a critical point of contention between buyers and sellers, particularly as the bearish trend progresses. This level serves as a significant area of resistance. With the ongoing bullish momentum, the price has reached this level, encountering strong resistance that has led to a minor correction or pullback.
Given the evident struggle between buyers and sellers at this level, a period of market consolidation is likely. However, if the market breaks out decisively above this level, it could trigger increased momentum, potentially driving the price toward the $1.20 mark.
Cardano Market Data
- ADA/USD Price Now: $1.092
- ADA/USD Market Cap: $38 billion
- ADA/USD Circulating Supply: 35 billion ADA
- ADA/USD Total Supply: 45 billion ADA
- ADA/USD CoinMarketCap Ranking: #9
Key Levels
- Resistance: $1.11, $1.20, and $1.30
- Support: $0.90, $0.80, and $0.75.
Cardano Through the Lens of Indicators
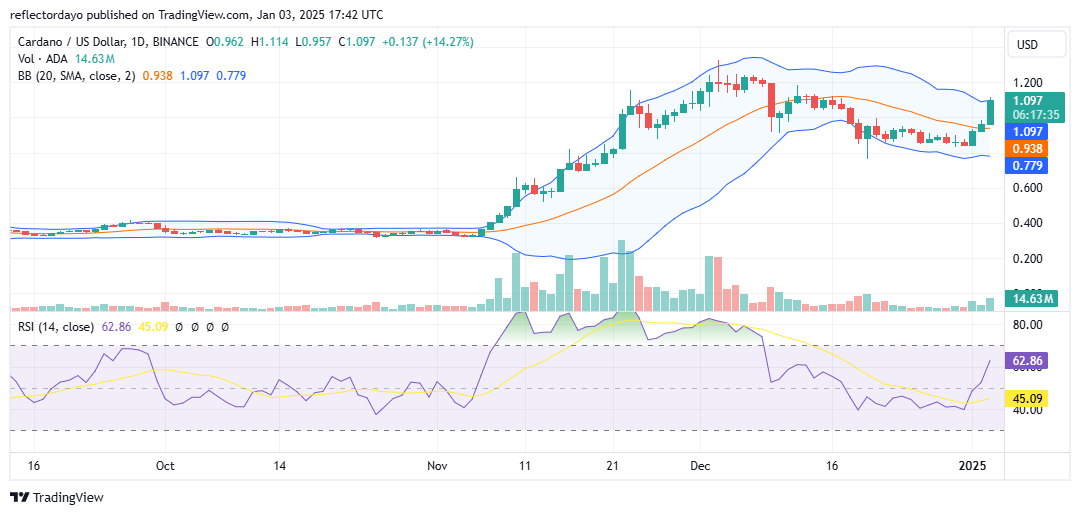
The Cardano market remained below the $0.40 price level for an extended period, dating back to August of last year. This trend persisted until early November, when the price experienced a significant surge, reaching approximately $1.20. However, profit-taking at this level quickly reversed the bullish momentum, leading to a substantial decline as sellers overwhelmed the market.
During the bearish phase, the market broke through two major price levels—$1.11 and $1.10—on its downward trajectory. At the start of the new year, the market experienced a rebound, with $0.85 serving as a critical support level. This recovery in the crypto signal pushed the price upward, breaking through the $1.00 resistance. However, the next key level to overcome is $1.10, which traders are likely monitoring closely as a pivotal resistance point.
The Relative Strength Index (RSI) currently stands at 62, indicating moderate bullish momentum. This suggests that the bulls may still have room to push the price higher. However, the rising RSI also signals that the market could soon approach overbought territory, potentially slowing the recovery.
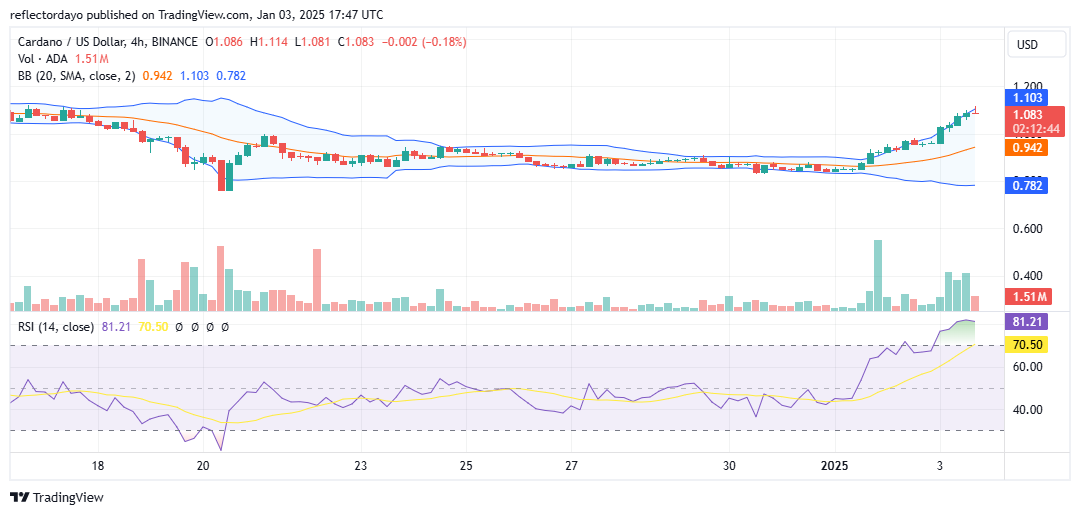
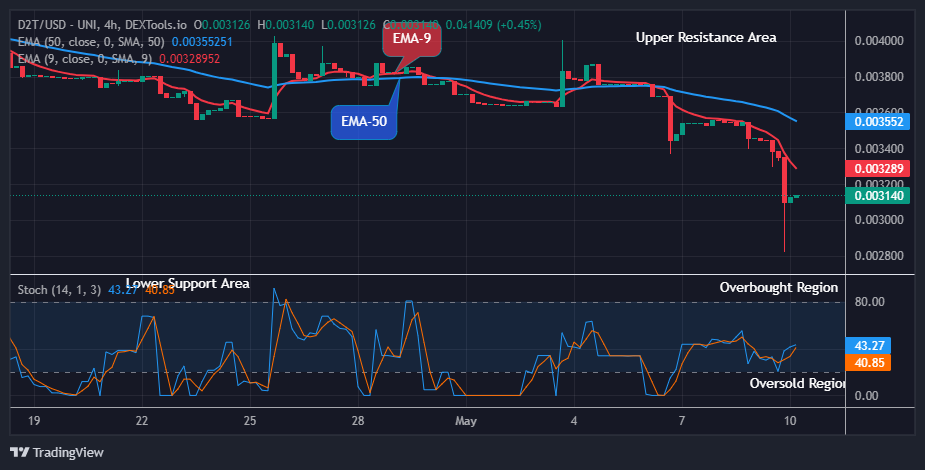
ADA/USD Price Prediction: 4-Hour Chart Analysis
The strength of the bullish run is clearly evident on the 4-hour chart, where the initial momentum appears strong. However, as the market approaches the $1.100 price level, the bullish momentum begins to decline significantly. The Relative Strength Index (RSI) indicates that, from the perspective of the 4-hour chart, the market is currently overbought. Consequently, the most recent candlestick patterns suggest that the market may be preparing for a downward correction. If this correction occurs, the $1.00 price level could serve as the next potential support point for a market rebound.