Chiliz (CHZUSD)’s Support Level Remains Strong Against Pressure
Estimated Reading Time: 2 minutes
Don’t invest unless you’re prepared to lose all the money you invest. This is a high-risk investment and you are unlikely to be protected if something goes wrong. Take 2 minutes to learn more
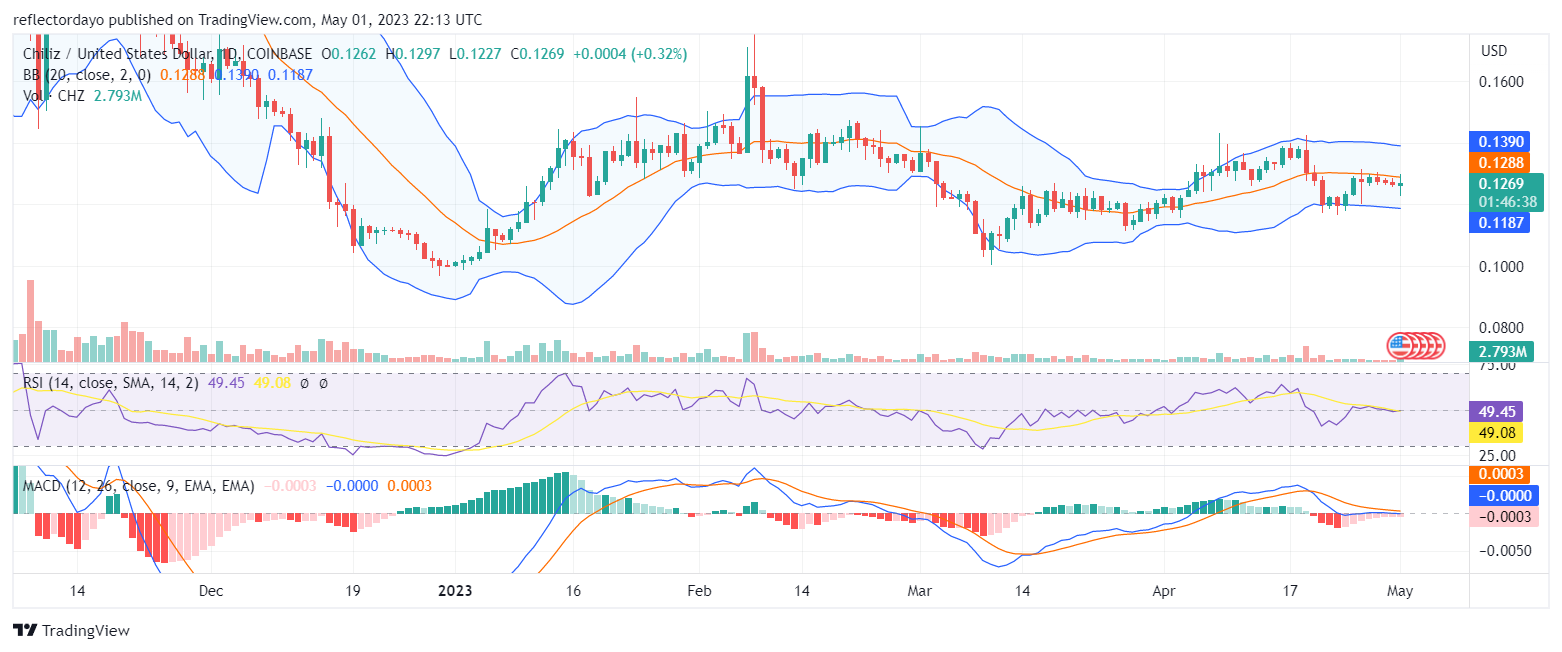
The Chiliz market today experienced strong pressure from both the bull market and the bear market. However, it is looking like the market will close today with a spinning top candlestick, which is highly indicative of indecision in the market. This indecision is not due to a lack of interest, as the spinning top candlestick points to active push and pull from the traders in today’s trading session.
CHZ/USD Price Statistics
- CHZ/USD Price Now: $0.127
- CHZ/USD Market Cap: $881,091,062
- CHZ/USD Circulating Supply: 6,943,647,158CHZ
- CHZ/USD Total Supply: 8,888,888,888
- CHZ/USD CoinMarketCap Ranking: #54
Key Levels
- Resistance: $1.40, $1.45, and $1.50
- Support: $0.11, $0.10, and $0.09
Price Prediction for Chiliz: The Indicators’ Point of View
According to the Relative Strength Index (RSI), the price of Chiliz is at the equilibrium level despite the significant activities of buyers and sellers in today’s trading session. The Moving Average Convergence and Divergence (MACD) indicator also supports this sentiment. The MACD line is currently moving along horizontally at the edge of the zero level as the negative fading histogram is almost blending with the zero level. This standoff at $0.128 may be because of the formation of a new resistance level or a new support level around the current price level. Investors need to be on alert for the next direction of the market before making a decision.
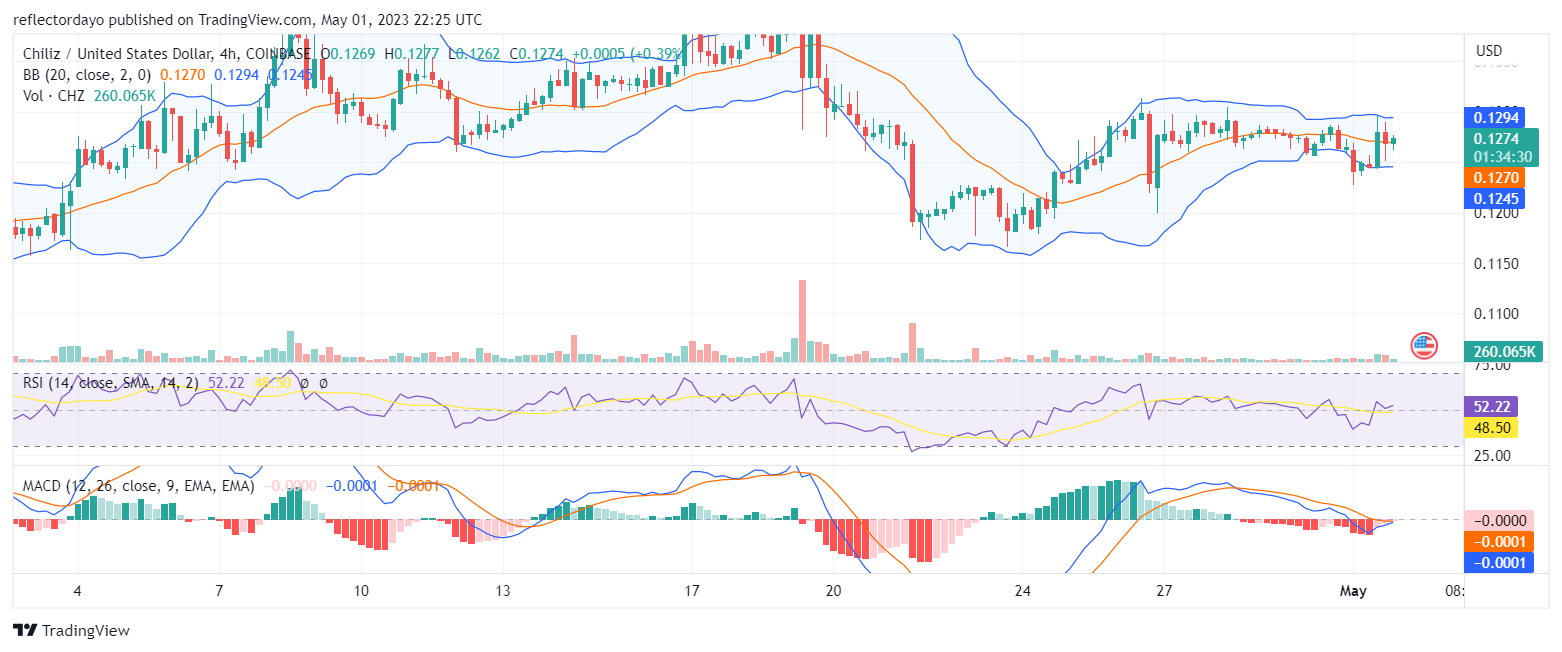
CHZ/USD 4-Hour Chart Outlook: A Bullish Cycle
From a 4-hour perspective, the very recent trading session blends with the 20-day moving average. From this smaller timeframe, we could predict that the market is going to have a bullish breakout after this standoff. This is because we see the market taking a strong base from $0.124 as its support level, and the current position of the price could be the formation of a new higher support level. Traders are focused on the Moving Average Convergence and Divergence (MACD) indicator. They are waiting for a bullish crossover of the two lines, and this is about to happen.