Binance Coin Is in a Range but Risks Further Decline to $245
Estimated Reading Time: 2 minutes
Don’t invest unless you’re prepared to lose all the money you invest. This is a high-risk investment and you are unlikely to be protected if something goes wrong. Take 2 minutes to learn more

Free Crypto Signals Channel
Binance Coin (BNB) Long-Term Analysis: Bearish
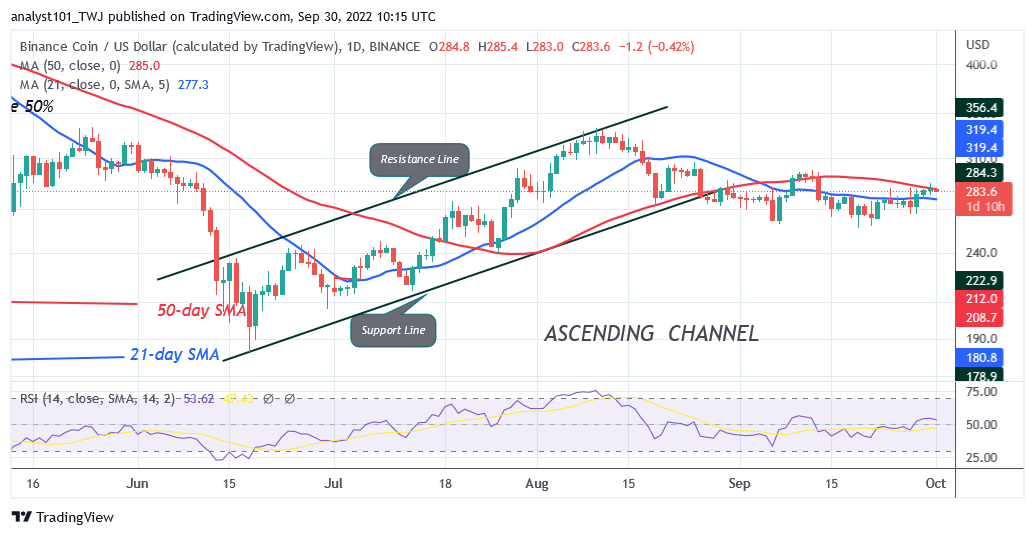
Binance Coin’s (BNB) price is in an upward correction but risks further decline to $245. However, the BNB price got stuck at the 50-day line SMA; hence there is a likelihood of a possible decline. Presently, BNB price is in a sideways move between levels $260 and $300 price levels. Since August 19, these range-bound levels have not been broken. It implies that the coin will continue its range-bound move. The uptrend will resume when price breaks above the $300 resistance. The market will rise and revisit the previous overhead resistance at $336. Nevertheless, if price breaks below the $260 support, BNB may decline to the low of $245 low.
Binance Coin (BNB) Indicator Analysis
BNB is at level 54 of the Relative Strength Index for period 14. The altcoin is in the bullish trend zone because of the recent upward correction. The moving average lines are sloping horizontally because of the sideways move. The price bars are between the moving average lines indicating a possible range move. The crypto is above the 80% range of the daily stochastic. The market has reached the overbought region indicating a possible decline of the cryptocurrency.
Technical indicators:
Major Resistance Levels – $440, $460, $480
Major Support Levels – $240, $220, $200
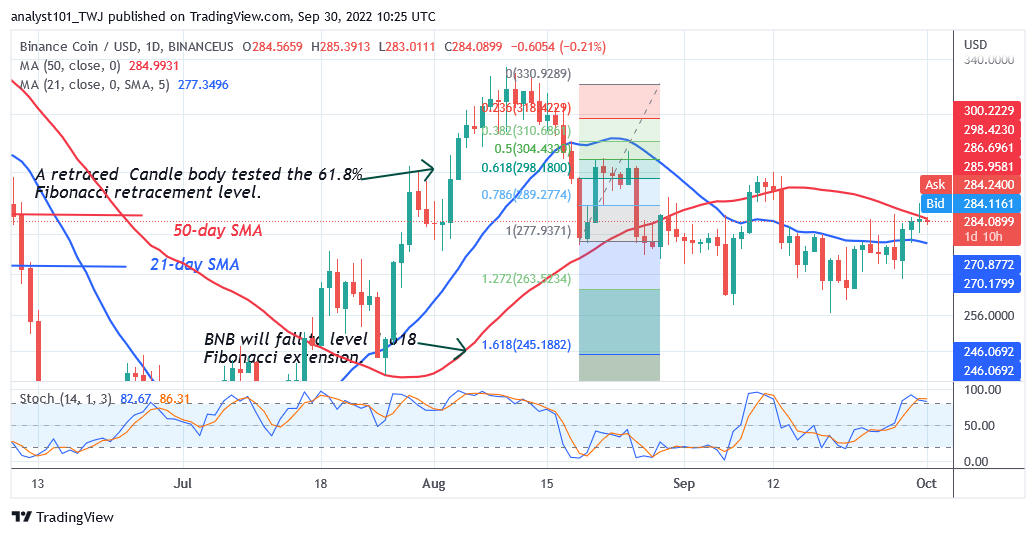
What Is the Next Direction for Binance Coin (BNB)?
The cryptocurrency is in a downtrend but risks further decline to $245. Meanwhile, on the current downtrend, a retraced candle body tested the 61.8% Fibonacci retracement level on August 21. The retracement suggests that BNB will fall to level 1.618 Fibonacci extensions or $245.18. The altcoin is trading at $284 at the time of writing.
You can purchase crypto coins here. Buy LBLOCK
Note: Cryptosignals.org is not a financial advisor. Do your research before investing your funds in any financial asset or presented product or event. We are not responsible for your investing results