Stellar (XLM/USD) Surges Above $0.45: Poised for the Next Move
Estimated Reading Time: 3 minutes
Don’t invest unless you’re prepared to lose all the money you invest. This is a high-risk investment and you are unlikely to be protected if something goes wrong. Take 2 minutes to learn more

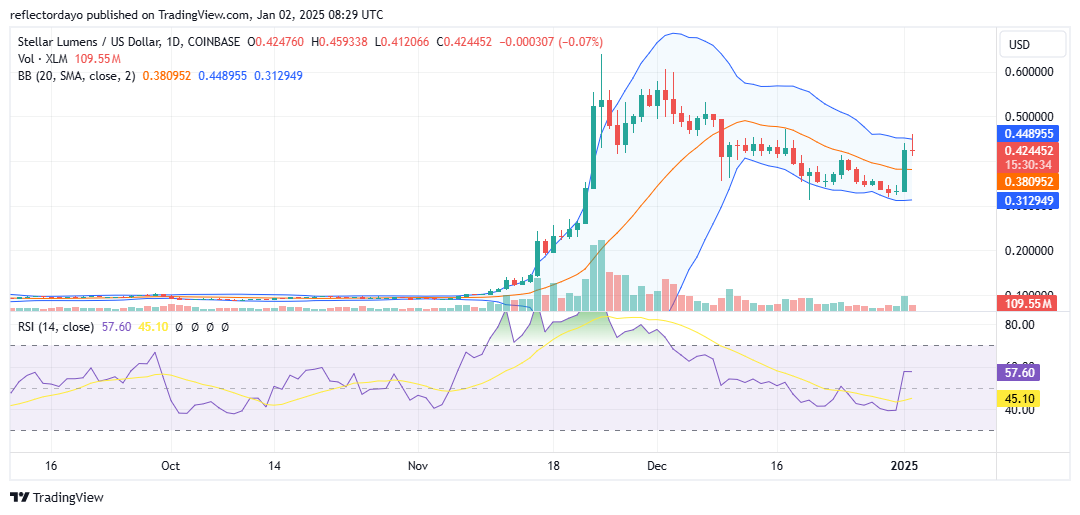
Stellar (XLM) rebounded from the $0.313 price level following a prolonged bear market that originated from its peak at $0.60. The bulls made several attempts to halt the bearish trend at the $0.40 level in December but were ultimately overpowered by sustained selling pressure. This led to a breakdown below $0.40, driving the price further down to $0.313.
The previous daily session exhibited a strong bullish move, which the bears are now attempting to counter. However, the bulls are holding their ground, keeping the market stabilized around the $0.42 level.
Stellar Market Data
- XLM/USD Price Now: $0.42
- XLM/USD Market Cap: $13 billion
- XLM/USD Circulating Supply: 30 billion
- XLM/USD Total Supply: 50 billion
- XLM/USD CoinMarketCap Ranking: #16
Key Levels
- Resistance: $0.45, $0.50, and $0.55
- Support: $0.35, $0.30., and $0.25.
Stellar Market Through the Lens of Indicators
The current trading session appears to be forming an inverted dragonfly doji pattern near the $0.40 level. This suggests a strong and potentially growing bullish bias at this critical support zone. The occurrence of this candlestick pattern near the market’s low point indicates a likelihood of a bounce.
However, the volume indicator’s histogram suggests that Stellar traders might be adopting a cautious stance. The small height of the candlestick reflects a continued balance between bullish and bearish forces.
If a bounce occurs, the price could target the $0.50 level. Conversely, if the crypto signal breaks below the $0.40 support, the next significant price level could be $0.313.
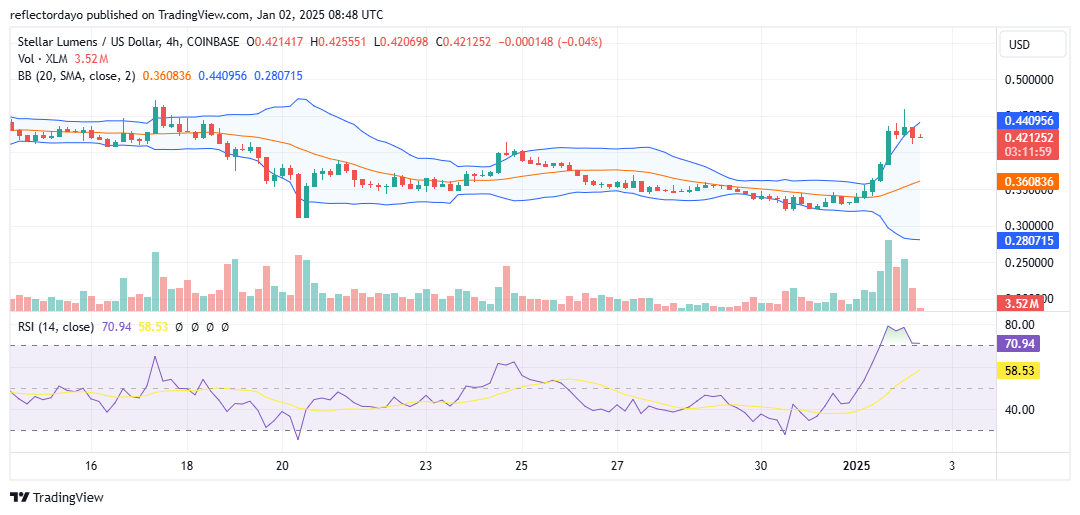
XLM/USD Price Prediction: 4-Hour Chart Analysis
On a smaller timeframe, the market shows bulls attempting to maintain support around the $0.42 level. However, this stability carries the risk of further downside movement. According to the Relative Strength Index (RSI), the indicator is ranging sideways above the 71 mark. This reading suggests overbought conditions, which could trigger a bearish bias as momentum above the 70 level often signals a potential for a downward correction.
If a correction occurs, the $0.40 level could serve as a likely bounce point, providing a critical support area for the price action.