Fantom (FTM/USD): Bulls Seize Momentum at $0.575
Estimated Reading Time: 3 minutes
Don’t invest unless you’re prepared to lose all the money you invest. This is a high-risk investment and you are unlikely to be protected if something goes wrong. Take 2 minutes to learn more

The Fantom market has been in a bearish trend since reaching the $1.50 price level in mid-December. The previous bullish rally began around the $0.575 level, where bearish momentum was halted and bullish sentiment gained traction. This shift triggered heightened market volatility, driving prices upward rapidly. However, the bullish rally lost steam as the market approached the $1.50 level, marking the end of the uptrend.
Notably, the bullish sentiment associated with the $1.50 level appears to be influencing current market behavior. The price has rebounded sharply from this level, suggesting a renewed push upward, possibly fueled by optimistic market participants.
The Fantom Market Data
- FTM/USD Price Now: $0.8105
- FTM/USD Market Cap: $2.3 billion
- FTM/USD Circulating Supply: 2.8 billion FTM
- FTM/USD Total Supply: 2.8 billion FTM
- FTM/USD CoinMarketCap Ranking: #56
Key Levels
- Resistance: $1.00, $1.10, and $1.11
- Support: $0.60, $0.50, and $0.45.
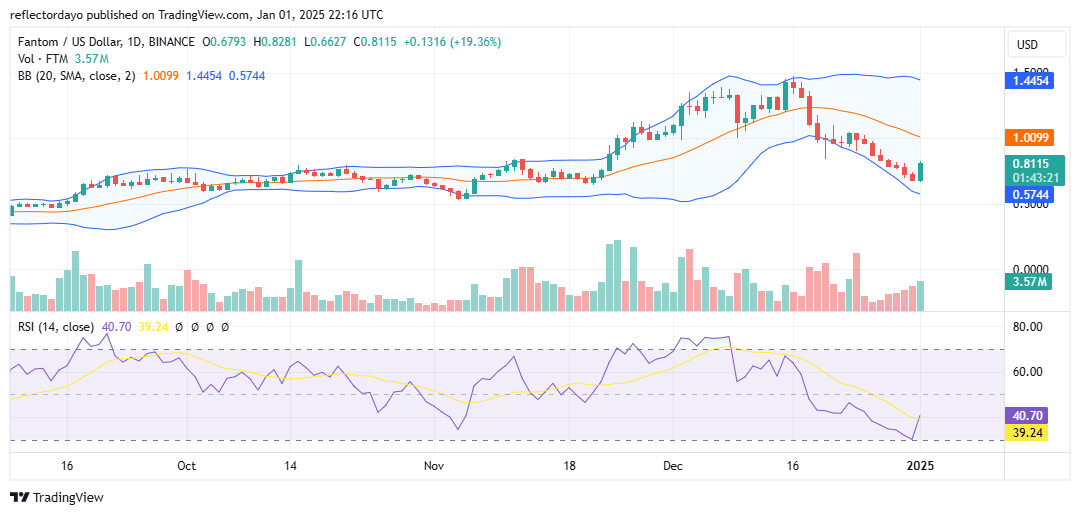
The Fantom Market Through the Lens of Indicators
The $0.575 price level has proven significant, as the Fantom price action rebounded sharply from this point. If the bulls can sustain this recovery and push the market toward the critical $1.00 level, it would indicate their strength and ability to maintain an upward trajectory.
However, the small upper shadow on the latest candlestick suggests emerging indecision around the current price level of $0.800. This crypto signal could indicate waning bullish momentum. The trading volume histogram reflects a recent surge in bullish sentiment, but the balance between buyers and sellers at this level suggests a potential stalemate.
If the indecision persists, the currently high market volatility—evidenced by the expanded Bollinger bands—may diminish significantly, confirming an emerging consolidation trend. Such a consolidation phase could signal that the market is preparing for another upward move, positioning itself for a potential bounce in the near future.
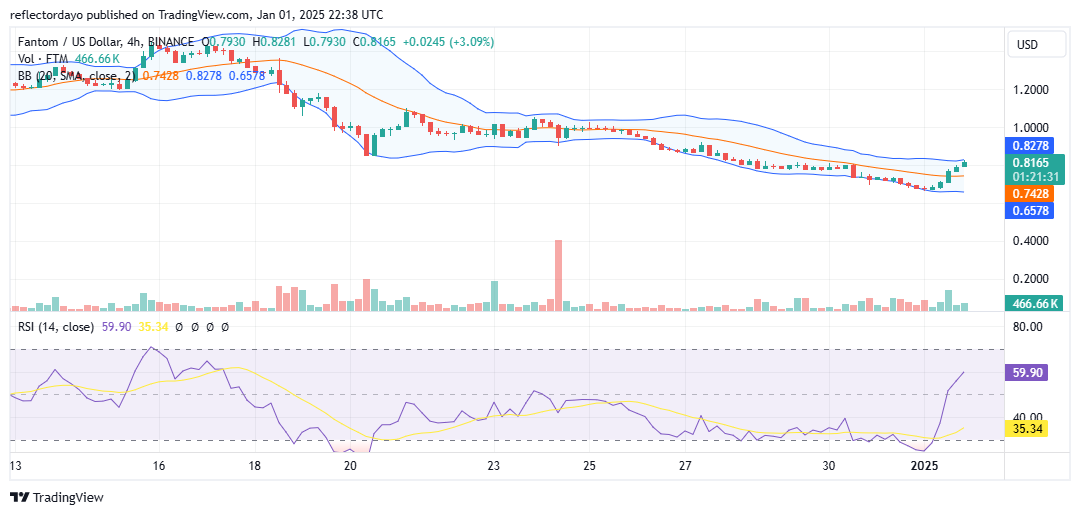
FTM/USD Price Prediction: 4-Hour Chart Analysis
The 4-hour chart provides a clearer view of the bulls’ actions, highlighting a slowdown in bullish momentum as the price approaches the $0.800 level. While the chart indicates that the bulls successfully broke above this critical resistance, with the price stabilizing around $0.818, traders appear cautious despite the breakout.
The RSI, currently at 60, coupled with the price action holding above the 20-day moving average, could encourage continued bullish sentiment. If the bulls maintain momentum above the $0.800 level, the price may surge further, potentially reaching the $1.00 mark.