Stacks (STX/USD) Primed for a Potential Bullish Rally
Estimated Reading Time: 3 minutes
Don’t invest unless you’re prepared to lose all the money you invest. This is a high-risk investment and you are unlikely to be protected if something goes wrong. Take 2 minutes to learn more
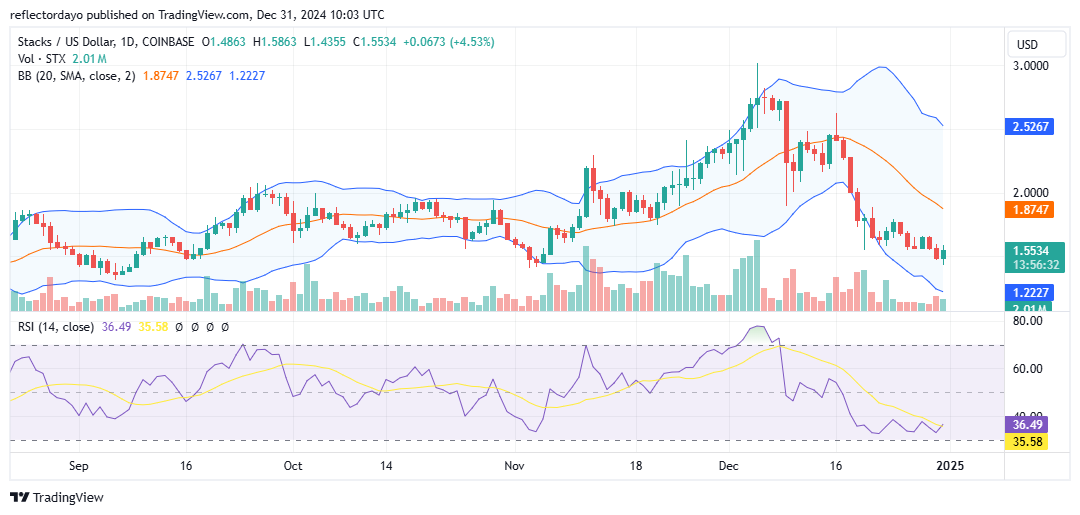
The Stacks (STX) market appears poised for another bullish run as the recent bearish correction from the $3.00 price level has halted upon reaching the critical psychological support at $1.50. This level has proven to be a significant support zone due to its historical relevance. Notably, in early November, the previous bullish rally originated from this same $1.50 level and steadily gained momentum, culminating at the $3.00 peak. Consequently, this support level is likely to evoke strong bullish sentiment, potentially driving a market reversal.
The Stacks Market Data
- STX/USD Price Now: $1.57
- STX/USD Market Cap: $2.37 billion
- STX/USD Circulating Supply: 1.5 billion STX
- STX/USD Total Supply: 1.5 billion STX
- STX/USD CoinMarketCap Ranking: #53
Key Levels
- Resistance: $2.00, $2.50, and $3.00
- Support: $1.20, $1.00, and $0.90.
The Stacks Market Through the Lens of Indicators
Following the bearish reversal at the $3.00 level, the price declined significantly faster than it had risen during the preceding bullish surge to the same level. This highlights an increase in market volatility, which facilitated the rapid drop to the key support zone. The heightened volatility is evident in the Bollinger Bands, which display a wide bandwidth. Given this, the Stacks price may rebound sharply as bullish participants capitalize on the volatility to trigger a strong rally.
However, if the bullish and bearish forces achieve equilibrium at this level, the market could enter a consolidation phase. During this period, volatility would decrease, signaling a pause in the activity of the crypto market. This consolidation phase is likely to precede the market’s next decisive move.
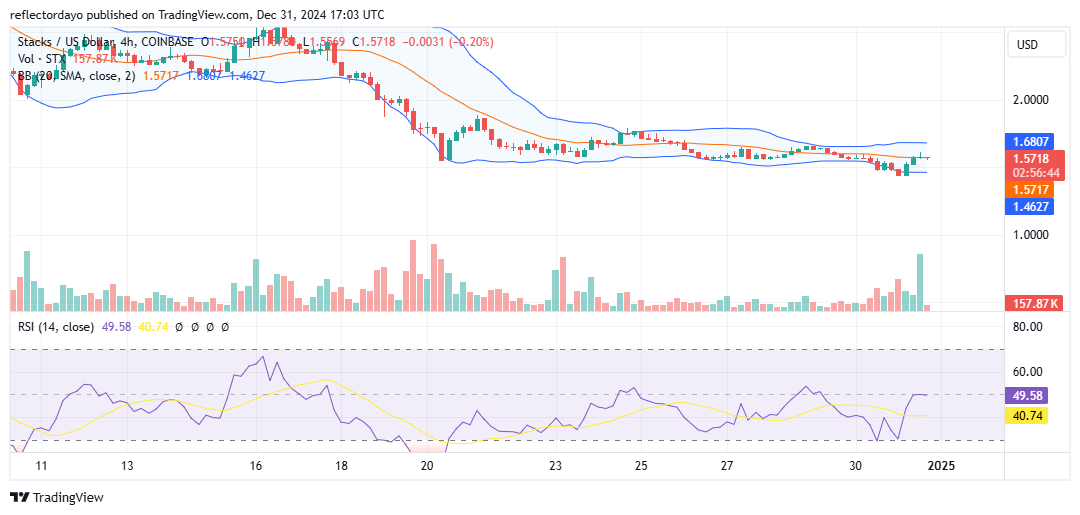
STX/USD Price Prediction: 4-Hour Chart Analysis
On a smaller timeframe, the market is consolidating along the $1.50 price level, with the Bollinger Bands reflecting reduced volatility. In the most recent session, a tall histogram indicated significant market activity, but the presence of a gravestone doji candlestick suggests that, despite pressure from both sides, the price action remains stagnant. This pattern highlights a state of strong indecision, further corroborated by the RSI, which is positioned precisely at 50. Given that this consolidation is occurring near a critical support level, a potential outcome could be a bullish rebound.