Band Protocol (BANDUSD) Continues Bullish Orientation Amidst Pullback
Estimated Reading Time: 3 minutes
Don’t invest unless you’re prepared to lose all the money you invest. This is a high-risk investment and you are unlikely to be protected if something goes wrong. Take 2 minutes to learn more
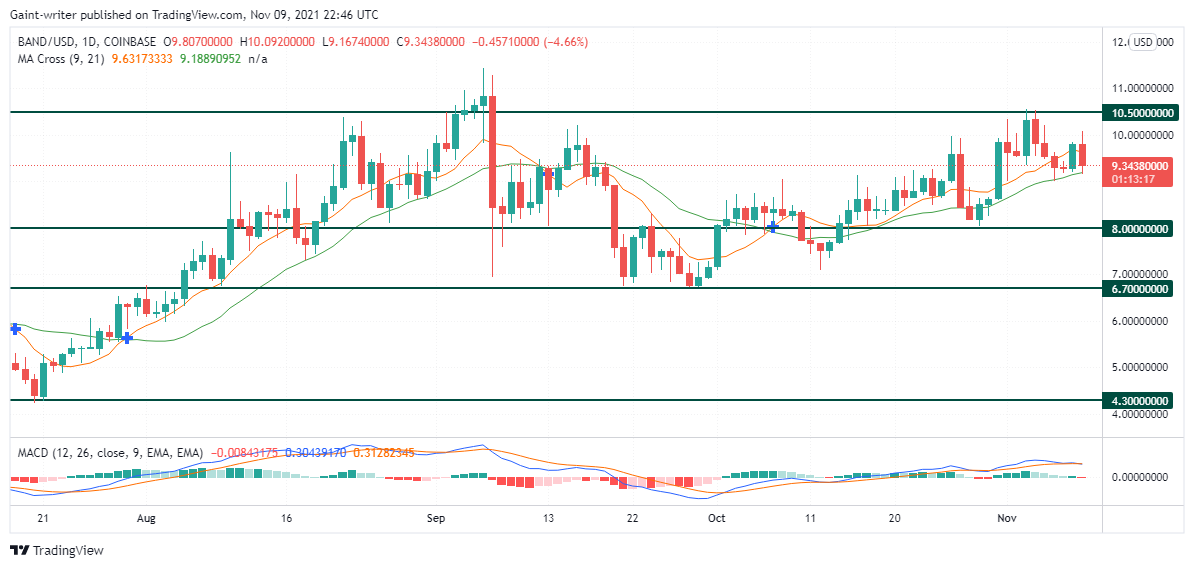
BANDUSD Analysis – Price Continues Bullish Orientation to $10.500 Significant Level
BANDUSD Continues bullish orientation to the $10.500 significant level, and the bears are also ready to interfere with price movement. BANDUSD having established a significant bullish strength, however, continues to gain control of the market environment. This implies that price movement for the bullish aspect will only exist when a bullish price signal holds the major share of the market position. Amidst all this, the sellers, are, however, also prepare to take firm action to drop the price below the $8.000 price level.
BANDUSD Significant Levels:
Resistance Levels: $10.500, $8.000
Support Levels: $6.700, $4.300
Band Protocol already engaged with the buyers’ market order. The market first encountered a bullish uptrend when price movement exhibited a quick price rally off $4.300 up to the $10.500 price level. The price level, however, encountered a market rally that breaks through several levels. When the market level got to the $10.500 resistance level, the price makes a solid drop and fights its way back to the $6.700 significant level with liquidity strength.
However, the market orientation plays more into a bullish moment again as prices now witness a new rise back to the $10.500 resistance level. The price again continues towards buyers direction as price momentum increases. More bullish order blocks is being created due to the significant creation of new higher highs and new higher lows in an uptrend movement. Market opposition by the bears also keeps influencing price movement as the price is assumed to break the $10.500 significant level. The daily chart displays price movement set through the green histogram and momentum speeds up indicating bullish control as the Moving Average keeps showing crosses in the consolidation zone.

Market Expectations
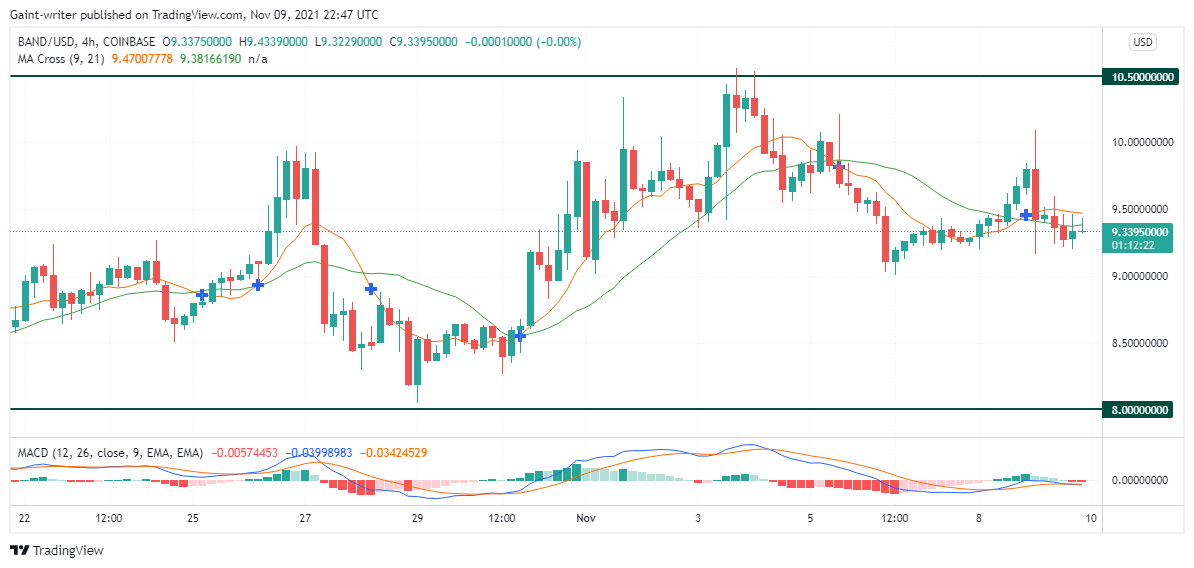
The 4hour chart displays a price strong consolidation as the market begins to witness a pullback. However, the price must eventually rise, breaking through the resistance level. Therefore, the coin movement is expected to break through the $10.500 resistance level when the pullback is over.
You can purchase crypto coins here: Buy Tokens
Note: Cryptosignals.org is not a financial advisor. Do your research before investing your funds in any financial asset or presented product or event. We are not responsible for your investing results.