Wall Street Memes (WSM/USD) Trade Is Weak, Muscling Catalysts
Estimated Reading Time: 3 minutes
Don’t invest unless you’re prepared to lose all the money you invest. This is a high-risk investment and you are unlikely to be protected if something goes wrong. Take 2 minutes to learn more
Wall Street Memes Price Prediction – January 28
A more lesser declining force has been allowed to thrive tentatively in the mode of pushing moves between bulls and bears of the market lines that paired the valuation of Wall Street Memes with the purchasing stance of the American currency, as the financial situation is weak, muscling catalysts in the wake of finding an all-time low.
The majority of subsequent price actions will likely be to create favorable conditions for longing position orders as soon as a sudden upsurge occurs in the form of a powerful bullish candlestick. This is especially true if the situation is combined with an oscillator arrangement that points north from a specific reduced point.
WSM/USD Market
Key Levels
Resistance levels: $0.0012, $0.0017, $0.0022
Support levels: $0.0005, $0.0004, $0.0003
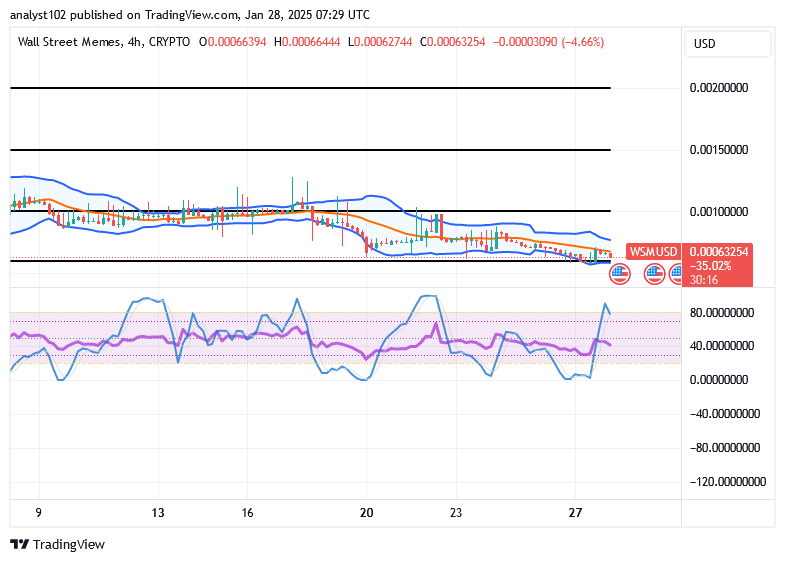
WSM/USD – 4-hour Chart
The WSM/USD market 4-hour chart showcases that the crypto-economic market is weak, muscling catalysts at a given lower end.
The overall technical outlook of the positioning pattern of the Bollinger Bands has surrendered to finding a mounting base around $0.0006. The stochastic oscillators are in a slight northbound-swerving mode, placing in the overbought region to give birth to a mere warning signal note against seeing untimely further pushes to the moon direction.
Should buyers of the WSM/USD market give in to disadvantages that often arise with regard to the oscillators’ positioning postures?
Considering the current positioning setup of the oscillating tools, it is not likely that some stances will surface in the direction of the negative side, as the WSM/USD trade is weak, muscling catalysts in inputs.
Traders looking to take long positions should focus on entering as the price approaches the support levels of 0.0005, 0.0004, or 0.0003. These levels present a good risk-to-reward setup, as the price is likely to bounce higher from these support zones, especially if momentum starts to shift in favor of buyers.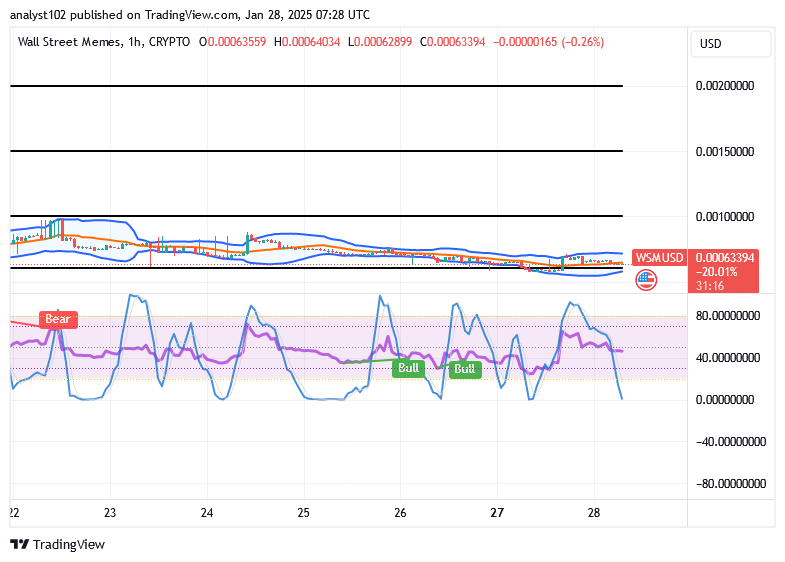
WSM/USD 1-hour chart
The 1-hour chart showcases that the WSM/USD market is weak, muscling catalysts at reduced trading spots.
The stochastic oscillators’ swerving approach has shown a significant amount of bullish-signal setups at various lower points, most of which include the oversold zone. The Bollinger Bands’ trend lines are still extending eastward, confirming the market’s sideways movement. With the hope that the price would ultimately break through the overhead resistance levels of 0.0012, 0.0017, and 0.0022, the market is offering long-position traders a chance to come close to the support levels of 0.0005, 0.0004, and 0.0003. Before expanding their holdings, traders should exercise patience and wait for evidence of a higher trend, especially a breakout over $0.0012.
Has the AI bubble burst recently?
Did the Ai bubble just pop? pic.twitter.com/PssbyLKynh
— Wall Street Memes (@wallstmemes) January 27, 2025
Buy and stake WSM now!: Wall Street Meme (WSM)