Wall Street Memes (WSM/USD) Price Is Lowly, Garnering Power
Estimated Reading Time: 3 minutes
Don’t invest unless you’re prepared to lose all the money you invest. This is a high-risk investment and you are unlikely to be protected if something goes wrong. Take 2 minutes to learn more

Wall Street Memes Price Prediction – January 27
Activities that have been devouring in the business operations of WSM/USD market have consistently on a tentative mode being in the control of bears, as the trade outlook now portends that the crypto-economic price is lowly, garnering power at given variant lower ends.
In order to acquire dip buys ahead of possible rebounds in a short amount of time, the losing activities of Wall Street memes in comparison to the pushing power of American fiat money must be viewed as open chance windows. Purchasing during a sharp increase may not have the appropriate weight to support the advances in the absence of reversals. Thus, it makes the most sense to continue building up market values at lower points as long as there hasn’t been any rebound.
WSM/USD Market
Key Levels
Resistance levels: $0.0012, $0.0017, $0.0022
Support levels: $0.0005, $0.0004, $0.0003
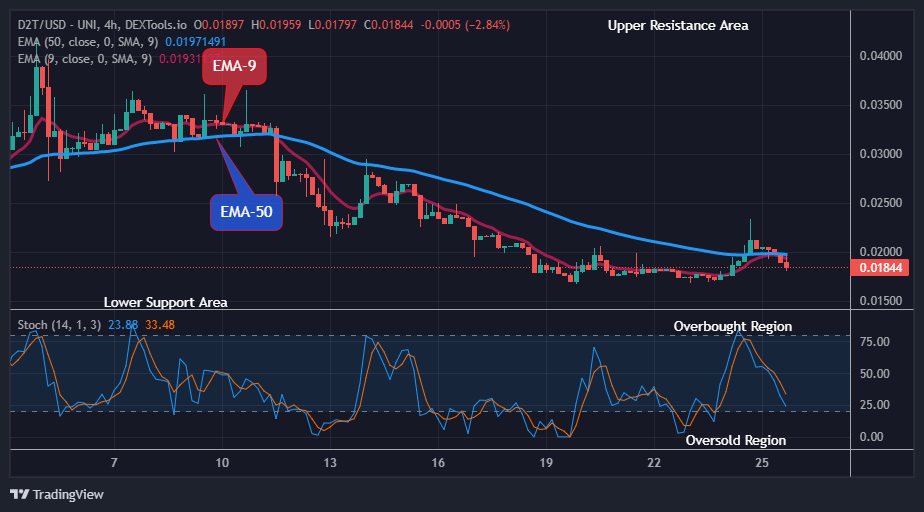
WSM/USD – 4-hour Chart
The WSM/USD market 4-hour chart showcases that the crypto-economic price is lowly, garnering power.
Since many candlesticks have shown lower lows and lower highs, indicating that a bullish resurgence is likely, the trend line of the lower Bollinger Band indicator has given birth to some lesser levels of negative pressure. In order to touch the oversold area, the stochastic oscillators have been slanting southward.
Would delaying the creation of a level of positions at this point be technically sound for the new, prospective WSM/USD traders?
Suspending the commencement of positions accumulation by now won’t signal good way of acting with the principles of dip buys, as the WSM/USD market is lowly, garnering power in the process.
It has been typical for the price to move to the lower side of the indications and then quickly return to its starting position for a comeback. Nevertheless, the negotiating environment is ideally becoming favorable for sending out indications that purchasers are actively working to add worthwhile moments to the base cryptocurrency’s trajectory.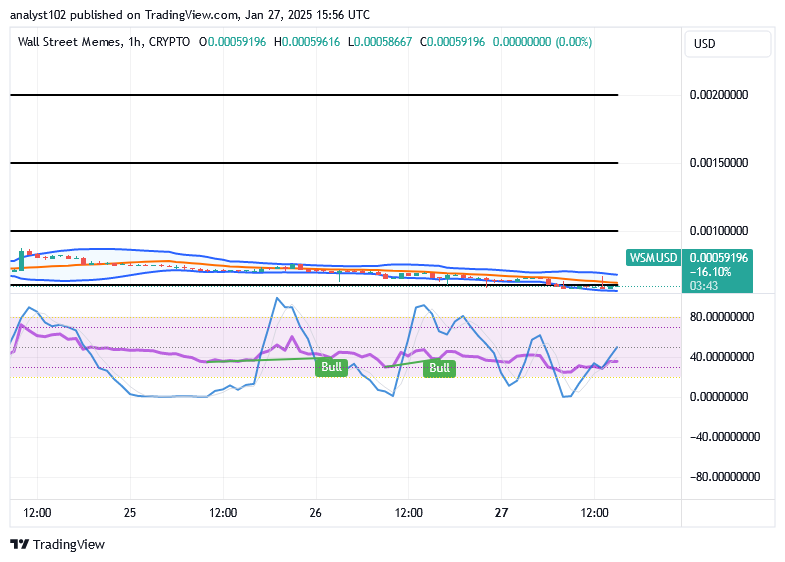
WSM/USD 1-hour chart
The 1-hour chart reveals that the WSM/USD market is lowly, garnering power on the threshold of the lower Bollinger Band indicator.
By touching the line of 40, the stochastic oscillators’ repositioning postures were obtained somewhat southbound, pointing slanting to the north, and the trend lines of the Bollinger Bands indicators were unable to change directions from not being stretched eastward. It seems that buyers are building muscles to begin pushing back northward.
Has the AI bubble burst recently?
Did the Ai bubble just pop? pic.twitter.com/PssbyLKynh
— Wall Street Memes (@wallstmemes) January 27, 2025
Buy and stake WSM now!: Wall Street Meme (WSM)