$SPONGE (SPONGE/USD) Clash: Bulls Dig In as Bears Circle
Estimated Reading Time: 2 minutes
Don’t invest unless you’re prepared to lose all the money you invest. This is a high-risk investment and you are unlikely to be protected if something goes wrong. Take 2 minutes to learn more

A clash near the $0.00005 resistance level saw bears take control, forcing $SPONGE bulls to regroup at the previously established support level of $0.000045. This consolidation suggests the potential for renewed buying pressure, with a price upswing towards $0.00006 a possibility if bullish momentum builds.
Key Market Dynamics:
- Resistance Levels: $0.0010, $0.0011, and $0.0012.
- Support Levels: $0.000035, $0.000030, and $0.000025.
Delving into Technical Analysis for $SPONGE (SPONGE/USD)
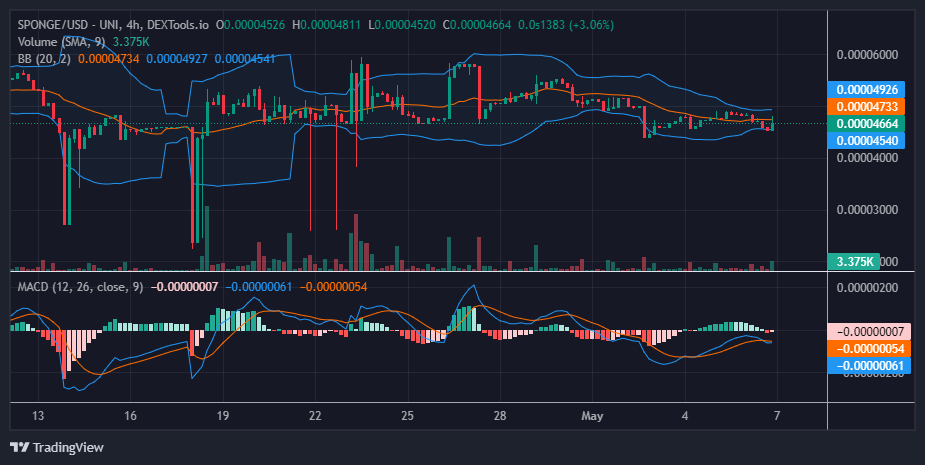
Initially, bulls controlled the $0.00005 price level, even pushing it higher to $0.000052. However, strong selling pressure emerged, causing a sharp decline and forcing bulls to retreat to the established support level at $0.000045. This consolidation might indicate an attempt to rebuild bullish momentum for another push upwards.
The recent price action shows an upward move, but the extended upper shadow on the current 4-hour candlestick suggests potential resistance from bears at $0.00005. Interestingly, the Bollinger Bands are contracting, hinting at a potential decrease in volatility. Despite this crypto signal, a slight increase in trading volume is evident, indicating some renewed investor interest.
Insights from the 1-Hour Perspective:
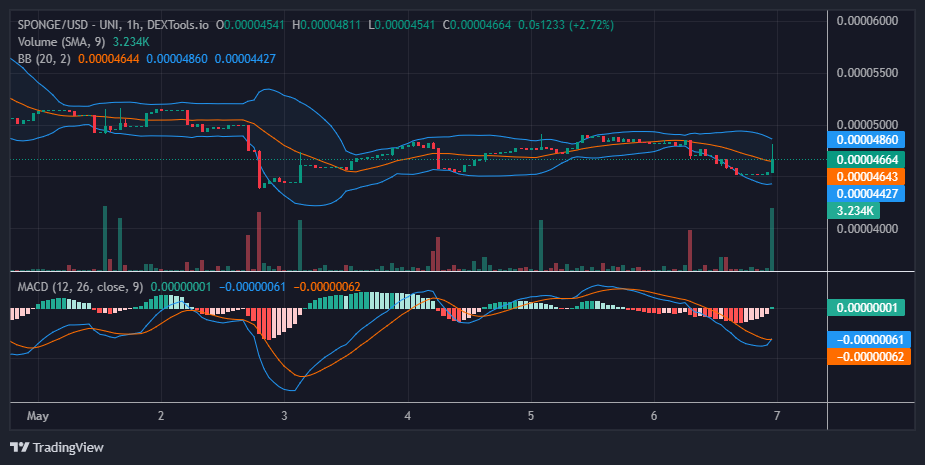
The 1-hour chart offers some positive signs for $SPONGE bulls, with a noticeable increase in buying pressure (bullish liquidity). However, bears remain a strong presence at the $0.00005 resistance level. The recent price surge may have attracted short sellers, as evidenced by the bearish move near this level.
Currently, the price finds stability around $0.000046, coinciding with the 20-day moving average. The converging Bollinger Bands suggest a potential decrease in volatility. This consolidation phase could see bulls fortifying the $0.000046 level as support, with the market potentially entering a period of sideways movement.
Buy SPONGE/USD!
It’s #MemeCoin SZN 🚀🚀🚀$SPONGE #SpongeV2 #Crypto pic.twitter.com/Uwe7lDN8ZG
— $SPONGE (@spongeoneth) May 4, 2024
Invest in the hottest and best meme coin. Buy Sponge ($SPONGE) today!