XRP Rebounds As It Encounters Resistance near $0.62
Estimated Reading Time: 2 minutes
Don’t invest unless you’re prepared to lose all the money you invest. This is a high-risk investment and you are unlikely to be protected if something goes wrong. Take 2 minutes to learn more

XRP (XRP) Long-Term Analysis: Bearish
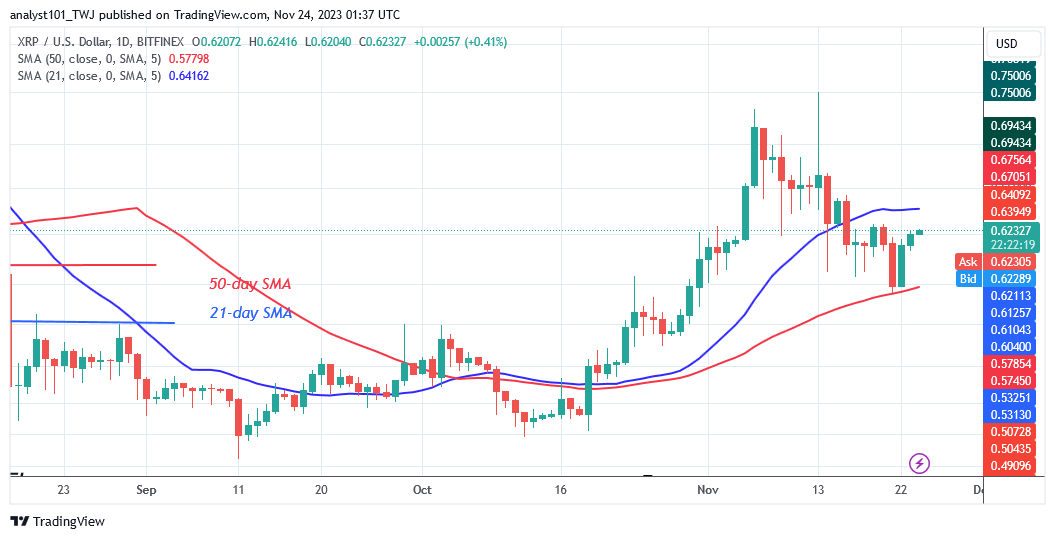
The price of XRP (XRP) is fluctuating between the moving average line as it encounters resistance near $0.62. Since November 16, the crypto asset has been caught between the moving average lines. When the altcoin breaks above the moving average lines, it will resume trending. Buyers are currently driving the coin higher.
On the plus side, if buyers retain the price above the 21-day simple moving average, the altcoin will rise to its previous high of $0.73. Buyers were unable to extend the previous price action’s rise due to resistance near $0.75. If the current bullish momentum is trapped at the 21-day SMA, XRP/USD will fall and trade in a range for a few days. The altcoin is now worth $0.62 at the time of writing.
Technical Indicators:
Major Resistance Levels – $1.00, $1.50, $2.00
Major Support Levels – $0.50, $0.30, $0.10
XRP (XRP) Indicator Analysis
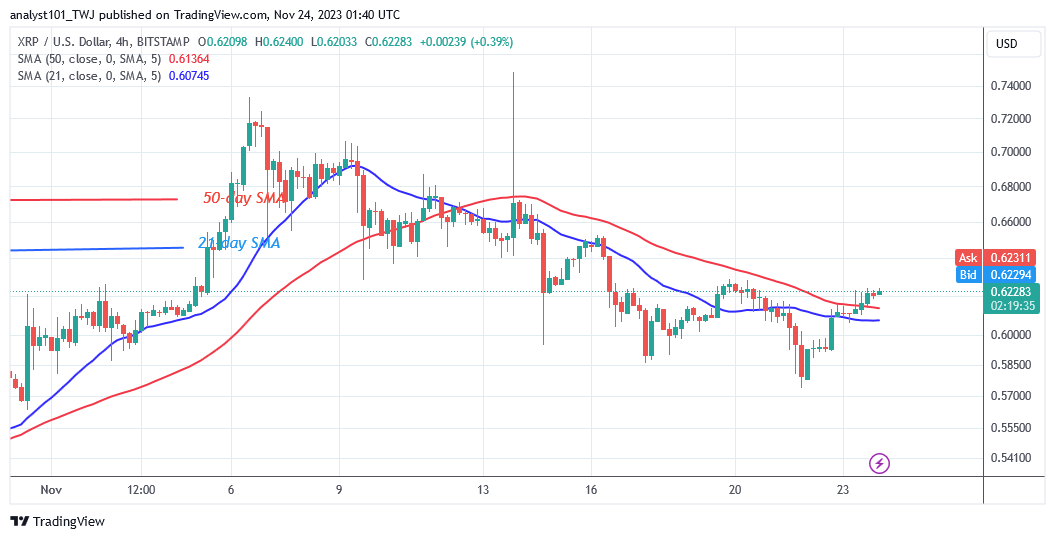
XRP is currently caught between the 21-day and 50-day moving average lines. The trend of the crypto asset is expected to continue as long as it breaks above or below the moving average lines. The 4-hour chart’s moving average lines are slipping southward as a result of the recent decline.
What Is the Next Direction for XRP (XRP)?
The crypto asset is rising as it encounters resistance near $0.62. Once the altcoin breaks above the 21-day SMA, a bullish trend will be restored. The price range is currently between $0.57 and $0.65. The coin will run into resistance on the upside as it gets closer to the 21-day SMA or the $0.62 high.
You can purchase crypto coins here. Buy LBLOCK
Note: Cryptosignals.org is not a financial advisor. Do your research before investing your funds in any financial asset or presented product or event. We are not responsible for your investing results