Dogecoin (DOGE) Price Prediction: DOGE/USDT Bounces Off the $0.1200 Baseline
Estimated Reading Time: 3 minutes
Don’t invest unless you’re prepared to lose all the money you invest. This is a high-risk investment and you are unlikely to be protected if something goes wrong. Take 2 minutes to learn more
Dogecoin (DOGE) Price Prediction: July 1
Price activity in the Dogecoin daily market can be seen dwelling below the $0.1300 threshold. The most recent session can be seen rebounding upward from the support level at the $0.1200 mark. Technically, this keeps the coin trading within the range of $0.1300 and $0.1200.
DOGE/USDT Long-term Trend: Bullish (Daily Chart)
Key Price Levels:
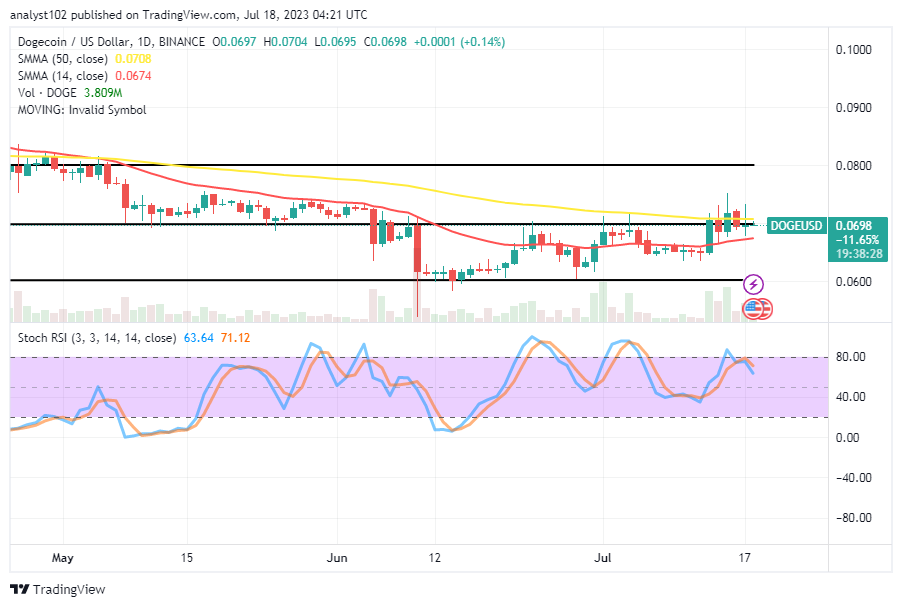
Resistance Levels: $0.0600, $0.0700, and $0.0800
Support Levels: $0.0500, $0.0400, and $0.0300
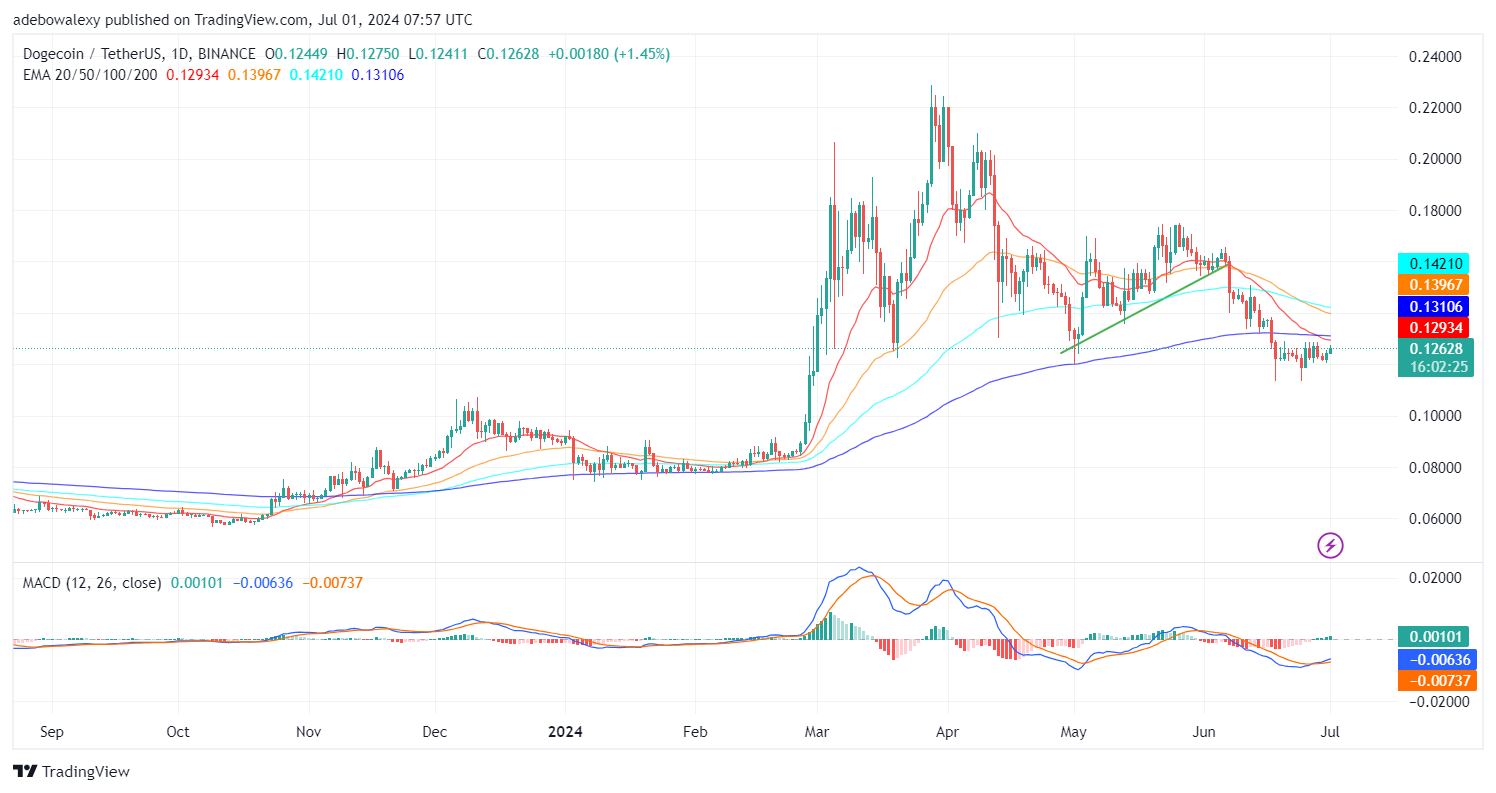
Today’s trading session in the Dogecoin market has landed yet another minimal price increase. The upside bounce started in the previous session, and the ongoing session has continued on that path. Nevertheless, trading activity remains below all the Exponential Moving Average (EMA) curves. Meanwhile, the MACD lines have performed an upside crossover below the equilibrium level. Additionally, the Moving Average Convergence Divergence (MACD) bars show that bullish momentum is building up even though price action is concealed below the EMA curves.
Dogecoin Price Prediction: The DOGE/USDT Upside Momentum Up Against Challenges
While price activity in the Dogecoin market has taken off from the baseline level of the $0.1200 price mark, the coin is still trading below all the EMA lines. The ongoing session has only presented another minimal upside movement. The MACD indicator has delivered a bullish crossover below the equilibrium level.
However, the MACD has only reflected the magnitude of price increases through its movement. The length of its bars indicates that the market has only seen minimal price increases. However, a closer look at the height of these bars reveals that they are getting taller, which indicates that upside forces are steadily rising on a minimal scale.
DOGE/USDT Medium-term Trend: Dogecoin Bulls Are Tackling Downward Rejections (4H Chart)
Price action in the Dogecoin 4-hour market time frame has surpassed the 20- and 50-day EMA lines. Despite this, the last price candle on the chart has revealed that a minimal downward correction has occurred in the market. Meanwhile, the MACD indicator lines and bars are staying bullish. The lines of the MACD can be seen rising through the equilibrium level. The bars of the indicator also retain their solid green appearance as they keep appearing above the equilibrium level.
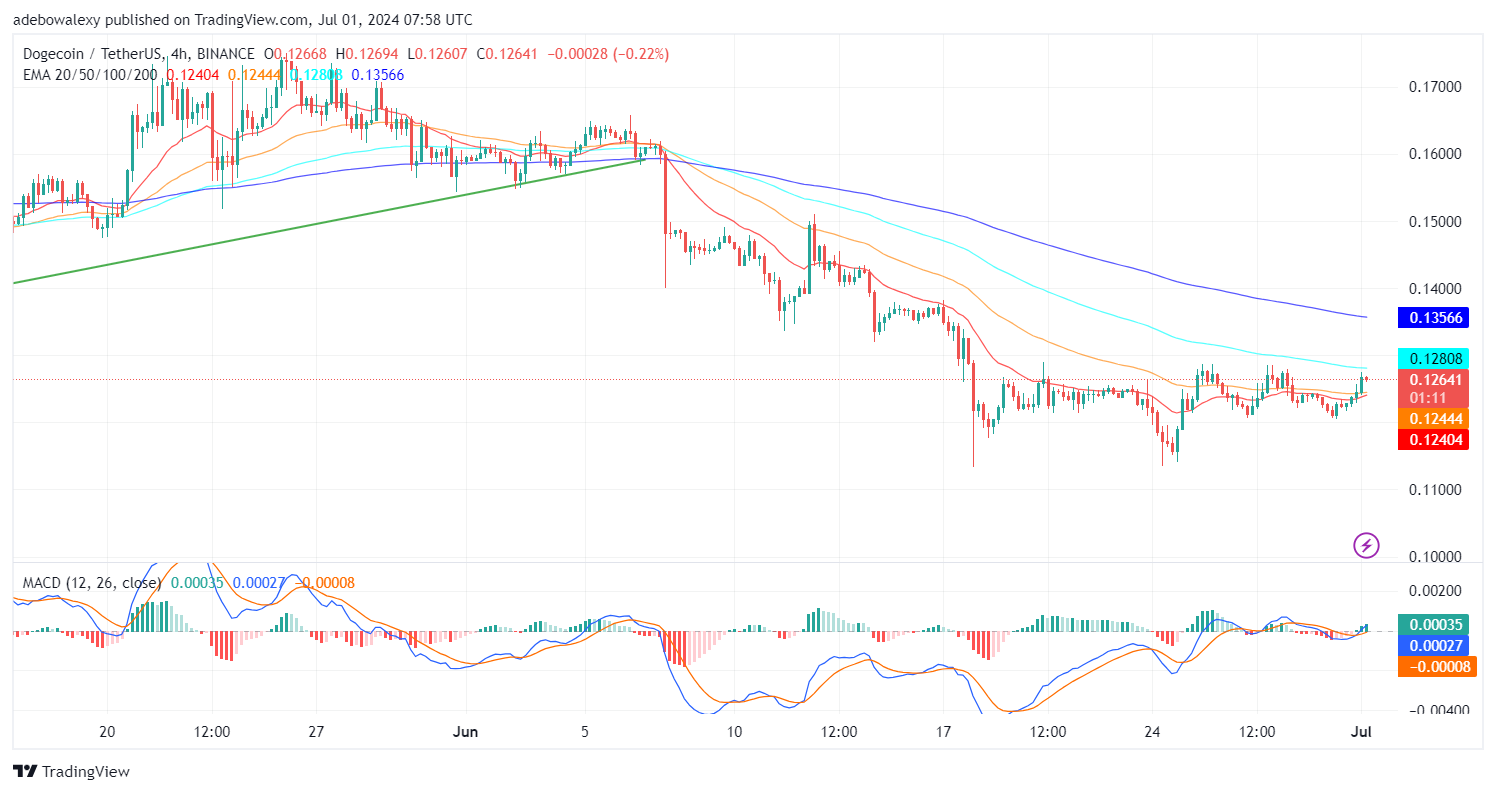
Therefore, it seems likely that upside forces will continue propelling the market through higher price levels. At this point, traders can aim at the $0.1300 technical resistance for a while. However, should price action rise above the 100-day EMA, more buying confidence may set in, and prices may continue towards the $0.1400 resistance.