Dogecoin (DOGE) Price Prediction: DOGE/USDT Slumps
Estimated Reading Time: 3 minutes
Don’t invest unless you’re prepared to lose all the money you invest. This is a high-risk investment and you are unlikely to be protected if something goes wrong. Take 2 minutes to learn more
Date: September 22, 2025
The crypto market is currently witnessing a bloodbath, and Dogecoin is not exempt from this effect. Although price action in the Dogecoin market has not been in the green recently, at least the bearish effect was not as strong as it is in the ongoing session.
DOGE/USDT Long-Term Trend — Bearish (Daily Chart)
Key Price Levels:
Resistance: $0.2500, $0.2750, $0.3000
Support: $0.2250, $0.2000, $0.1750
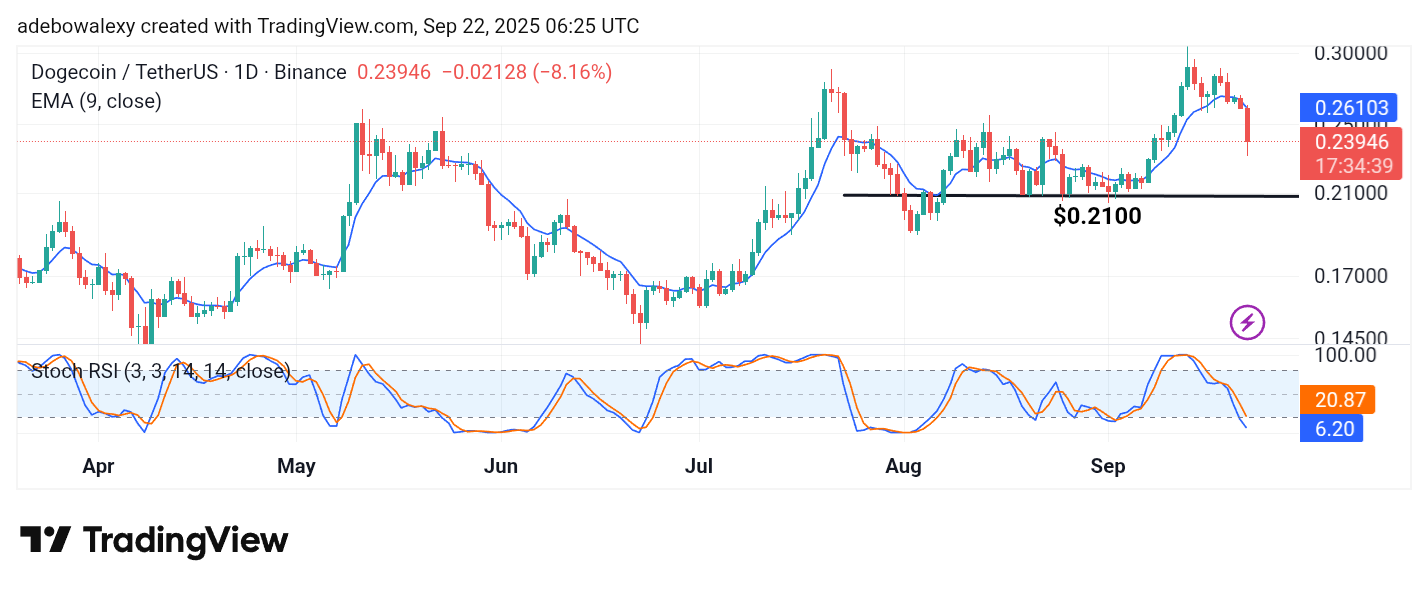
The current session in the Dogecoin market has produced a massive downward retracement. This can be observed through the last price candle on the chart as it plunges significantly below the 9-day Exponential Moving Average (EMA) line. As a result, the Stochastic Relative Strength Index (SRSI) indicator lines are racing downward into the oversold region. The lines of this indicator are now in the oversold zone, and the terminal parts show no sign of deflection toward an upside crossover.
Dogecoin (DOGE) Price Prediction: DOGE/USDT Bears Keep Pressuring
The Dogecoin market on the daily chart reflects massive strength from bearish traders. However, this appears to be a reaction to the sudden crash in Bitcoin’s price. The ongoing session in the Dogecoin market has produced massive losses, with price action falling even further below the 9-day EMA curve.
The trajectory of the SRSI indicator lines also indicates that headwinds remain highly active and may drive a continued downward retracement. Although an upward contraction can be seen on the last price candle, the bears still hold the overall sway in the market.
Dogecoin (DOGE) Price Prediction: DOGE/USDT Bears Maintain a Strong Grip on the Market (4-Hour Chart)
Price action in the Dogecoin 4-hour market continues to stay in the red. Here, price candles have been forming consistently below the 9-day EMA line for seven straight sessions.
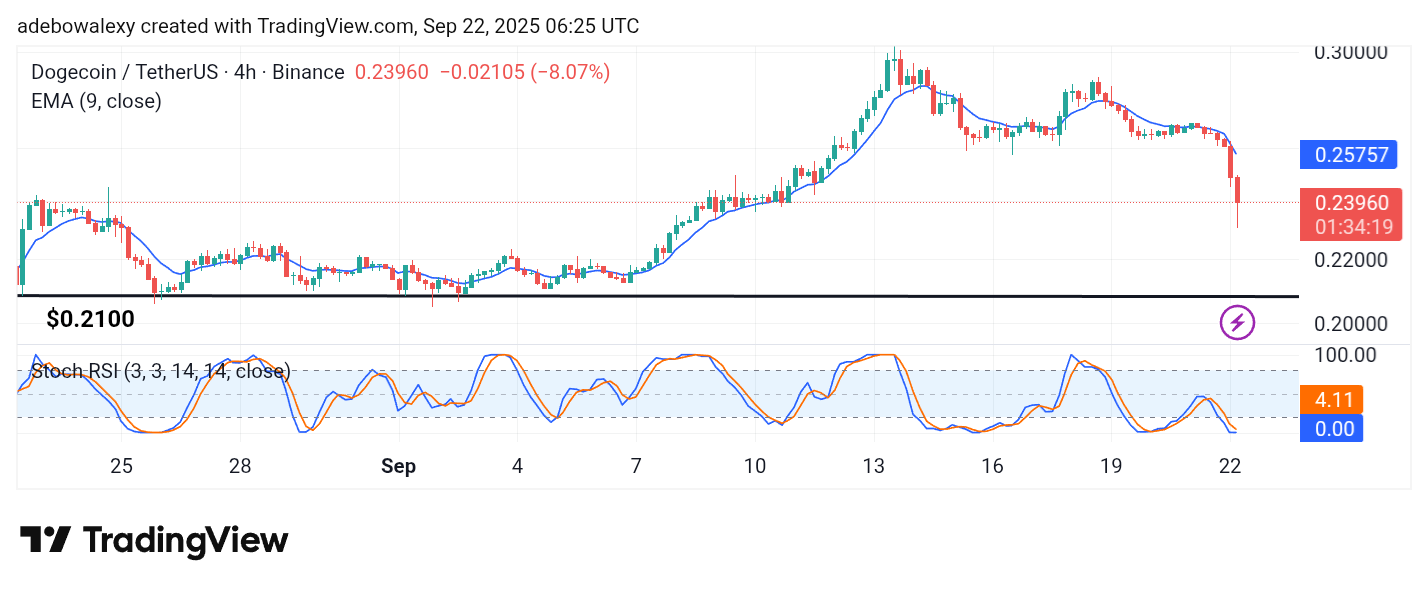
The last price candle on the chart has a visible red body but also shows an upward contraction.
Technically, this indicates that buyers are silently becoming active, pushing for a slight market contraction upward. Meanwhile, the line of the SRSI indicator has reached the 0.00 mark in the oversold region. Therefore, this market may advance toward the $0.2200 price level in subsequent sessions.