Dogecoin (DOGE) Price Prediction: DOGE/USDT Extends Previous Losses
Estimated Reading Time: 3 minutes
Don’t invest unless you’re prepared to lose all the money you invest. This is a high-risk investment and you are unlikely to be protected if something goes wrong. Take 2 minutes to learn more

Date: September 15, 2025
While the Dogecoin market saw an impressive upward correction over the previous week, it appears that bears are now seizing control. This has caused prices to slip lower, moving toward a psychological support level.
DOGE/USDT Long-Term Trend — Bearish (Daily Chart)
Key Price Levels:
Resistance: $0.2700, $0.3000, $0.3250
Support: $0.2500, $0.2250, $0.2000
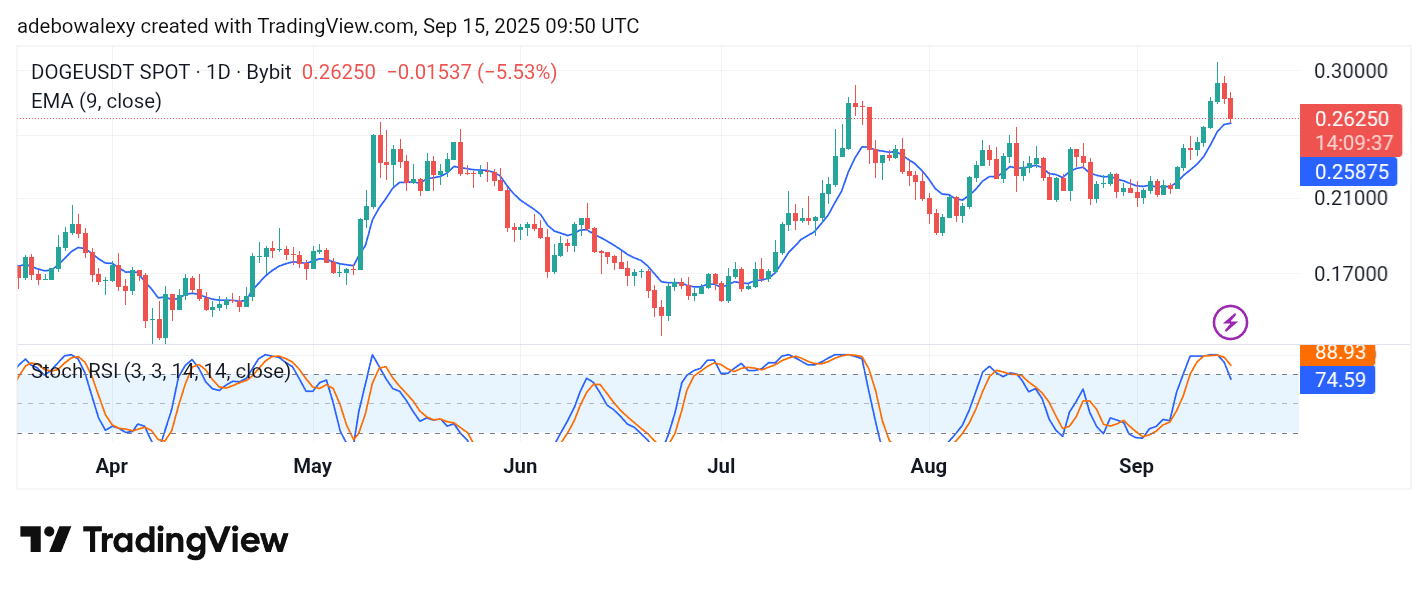
The ongoing session in the Dogecoin daily market suggests that bearish momentum is accelerating. The corresponding price candle for the current session is bearish, even though its base remains above the 9-day Exponential Moving Average (EMA) curve. Meanwhile, the Stochastic Relative Strength Index (SRSI) has turned downward after stalling near the 100 level. The leading line of the indicator has dropped past the 80 mark and is now at 74, while the lagging line stands at 88.98 as of the time of writing.
Dogecoin (DOGE) Price Prediction: DOGE/USDT Bears Gain Prominence
Given that price action on the Dogecoin daily chart has been declining for two consecutive sessions with growing momentum, the market may face further downside pressure.
Nevertheless, it is worth noting that price action still stands above the 9-day EMA line. Similarly, the lines of the SRSI indicator remain above the 70 threshold despite their current downward trajectory. However, considering the momentum, bears may continue to press lower. Therefore, a breach of the base formed by the 9-day EMA curve may signal a stronger bearish shift.
Dogecoin (DOGE) Price Prediction: DOGE/USDT Set to Descend Further (4-Hour Chart)
By looking at the Dogecoin market on the 4-hour chart, it is clear that bears are presenting a stronger threat. For about five sessions, price action has remained trapped below the 9-day EMA line.
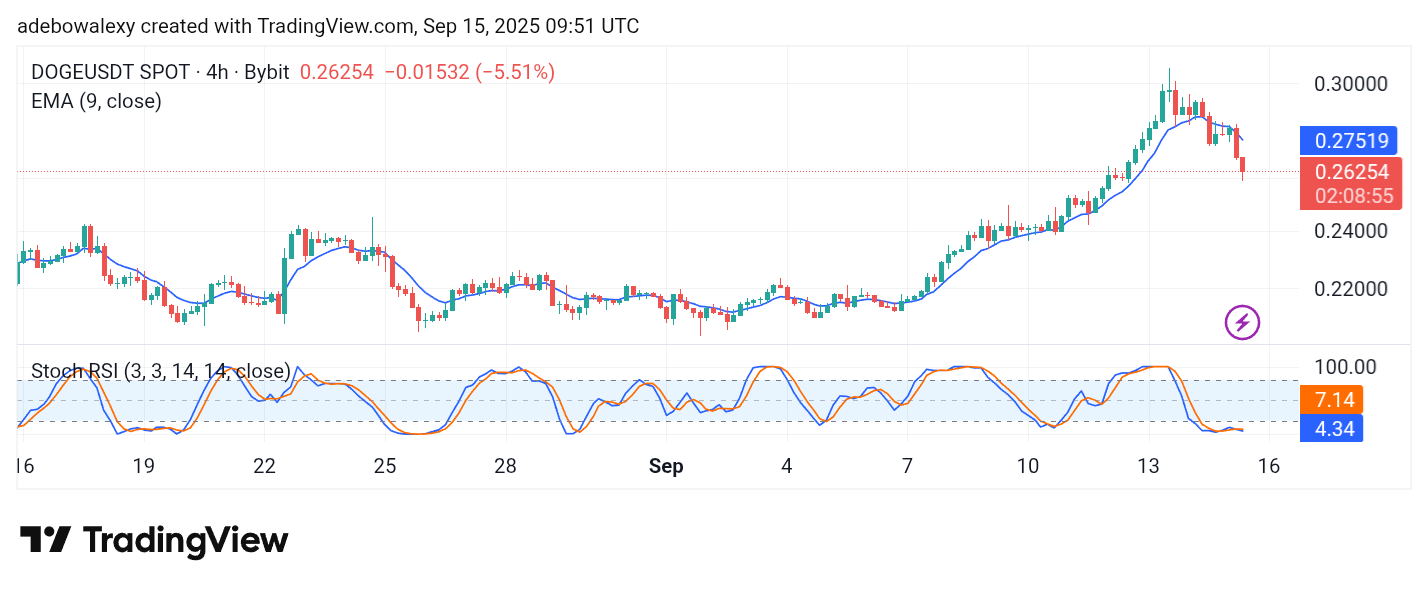
The ongoing session continues this trend, with the SRSI lines merged and moving sideways below the 10 mark of the indicator. From here, price action appears likely to descend further toward the $0.2500 support level. Therefore, traders may consider maintaining a bearish stance on this market until the mentioned psychological price level is reached.