Quant Price Prediction: QNT/USD Heads Towards Critical Resistance Level
Estimated Reading Time: 3 minutes
Don’t invest unless you’re prepared to lose all the money you invest. This is a high-risk investment and you are unlikely to be protected if something goes wrong. Take 2 minutes to learn more
Quant Price Prediction: September 18, 2024
Recently, Quant (QNT) against the United States Dollar (USD) has consistently risen, with its current price at $71.21. The pair reaches for the $72.58 level. However, obscurity still surrounds the pair’s continuous bullish trend or short-term correction towards the south.
At this juncture, the question remains whether Quant can muster enough buying pressure using the recent occurrence in the crypto market or face a temporary pullback before attempting another upside movement.
QNT/USD Long-term Trend: Bullish (Daily Chart)
Key Levels:
Resistance Levels: $72.58, $79.78, and $67.41
Support Levels: $56.99, $62.38, and $67.41
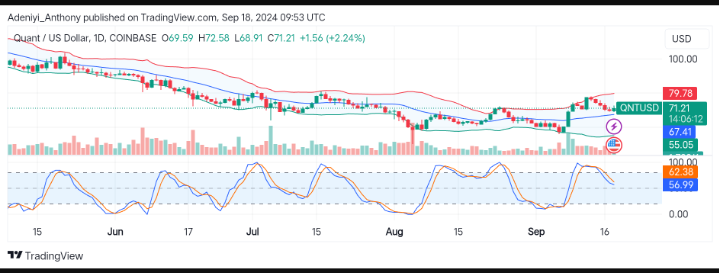
Quant, on the daily chart, has managed to secure a bullish move despite moderate trading volume, which is signaling caution from traders.
However, recent activities in the cryptocurrency market seem to be influencing the pair’s price action. Bitcoin and Ethereum have experienced price swings this September due to increased volatility. As these major cryptos dictate broader market sentiment, QNT may as well move to the tone of their performance.
Quant Price Prediction: Condition for a Continuous Upside Trend
The Bollinger Band displays that Quant is trading near the upper band, traditionally; this gives a warning that bullish power is near exhaustion.
However, the narrowing of the bands suggests the market may consolidate before making any decisive move.
Historically, the $72.58 level has acted as a barrier for the Quant upside trajectory multiple times. A strong trading volume could see the pair slice through this line.
On the downside of the chart, the Stochastic Relative Strength Index (RSI) suggests a short-term correction could be imminent if the oscillator crosses downward as momentum wanes.
QNT/USD Short-term Trend: Bearish (4H Chart)
In the 4H time frame, QNT/USD trades at $71.21, but appears to be dropping by a little percentage compared to the previous session. The price appears to be trading slightly below the middle Bollinger Band, indicating a bearish run.
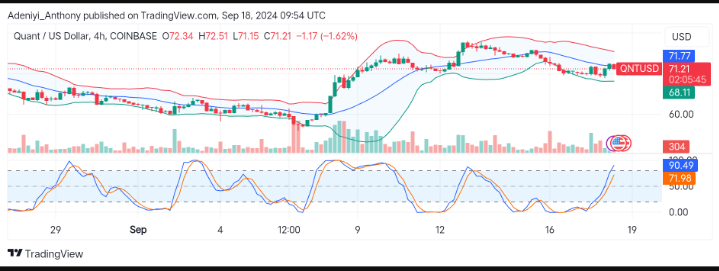
Considering the current position of the price and closeness to the lower Bollinger Band, along with the overbought condition of the Stochastic RSI, there could be a further decline in price or consolidation around the current levels. However, if buyers step in and the pair manages to hold above the $71 support level, a rebound to the upper band is possible.
In conclusion, QNT/USD on the 4H chart looks slightly bearish until Quant finds support near $71 for a bounce to occur. Till then, patience and the formation of the next few candles will confirm entry.
In order to place winning trades with us via Bybit, you can open an account here.