Arbitrum Price Prediction: ARB/USD Shows a Potential Rebound Amidst Prolonged Downtrend
Estimated Reading Time: 3 minutes
Don’t invest unless you’re prepared to lose all the money you invest. This is a high-risk investment and you are unlikely to be protected if something goes wrong. Take 2 minutes to learn more
Arbitrum Price Prediction: September 17, 2024
Despite recent bearish movements, Arbitrum (ARB) against the United States Dollar (USD) appears to be showing signs of consolidation and potential recovery.
Arbitrum has been showing resilience by not dipping below the $0.500 level, though it is still acting under the Guppy Multiple Moving Averages GMMA. However, the price actions between $0.5200 and $0.5400 levels could fuel more bullish movement.
At this point, traders may need to watch out for a potential breakout or a continued downtrend.
ARB/USD Long-term Trend: Bearish (Daily Chart)
Key Levels:
Resistance Levels: $0.5200, $0.5400, and $0.5600
Support Levels: $0.4500, $0.4800, and $0.5000
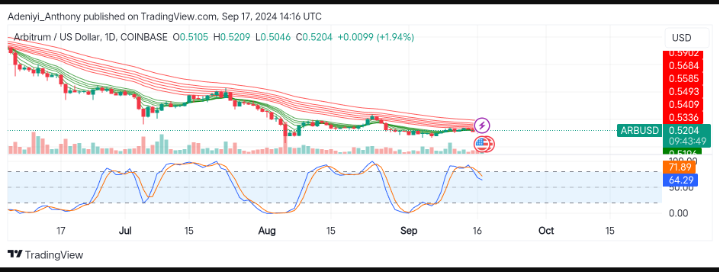
For the past few months, ARB/USD has failed to maintain higher price levels. The price has been consistently falling since $0.6 July’s high. The price at this stance seems to be showing signs of consolidation and potential recovery.
Arbitrum Price Prediction: Condition for Upside Correction
The overall market condition for Arbitrum is still bearish, but the indicators are suggesting a trend reversal is on the horizon. However, a break above the $0.5400 secondary level would guarantee this bullish prescient. Arbitrum is currently trading at $0.5204, representing a slight increase from where it was at the start of the day.
On the other hand, though a little spike in trading volume may not guarantee a shift in trend, the Stochastic Relative Strength Index (RSI) is in the neutral zone. However, an upward movement by the indicator into the overbought position may suggest the buildup of a more bullish trend.
Contrarily, the market condition can not be considered stable, and a dip beyond $0.510 may see the price proceed towards the psychological $0.500.
All the price actions are underneath the GMMA. Therefore, traders may want to consider the key levels, but caution is advised.
ARB/USD Short-term Trend: Bullish (4H Chart)
Arbitrum (ARB) on the 4H chart is trading at $0.518, reflecting a slight shift from the recent position. This could suggest a slight recovery after a recent pullback.
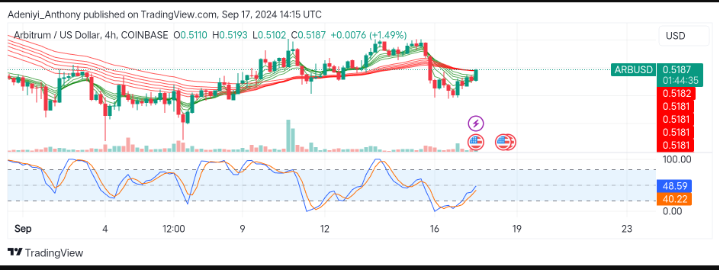
Arbitrum in this timeframe recently bounced from the $0.51 area and is proceeding northward. Indicators are suggesting more bullish momentum is building up.
However, ARB will maintain its current upward momentum and break the $0.5200 resistance level if there is a sustained increase in volume. But a break or decline in the movement of the Stochastic (RSI) and the volume will make the price test the recent and subsequent support lines.
In order to place winning trades with us via Bybit, you can open an account here.