Quant Price Prediction: QNT/USD Bearish Momentum Persists Amid Market Uncertainty
Estimated Reading Time: 3 minutes
Don’t invest unless you’re prepared to lose all the money you invest. This is a high-risk investment and you are unlikely to be protected if something goes wrong. Take 2 minutes to learn more

Quant Price Prediction: September 11, 2024
The Quant price has been punctuated by a period of consolidations and recoveries, though it has been on a downward trend since May. Recently, the pair went bullish, but it is experiencing sustained bearish momentum on the daily chart.
The technical indicators suggest the downtrend might continue as the market struggles to regain traction. However, traders are closely watching for signals that would stabilize the downtrend.
QNT/USD Long-term Trend: Bearish (Daily Chart)
Key Levels:
Resistance Levels: $74.86, $90.84, and $95.00
Support Level: $50.00, $55.73, and $65.74
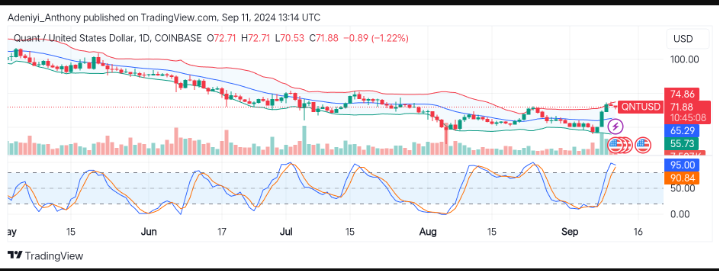
QNT/USD since May has been on an extended downtrend, with slight bullish momentum recently, with the price currently operating at $71.88. On the daily chart, there are short-term consolidation periods, but the direction of the pairs looks southward.
Indicators on the chart are signaling a further bearish move. However, the price will need to break the $65.29 support level.
Quant Price Prediction: QNT/USD Struggles to Maintain Support
The Bollinger Band paints a bearish picture for Quant in this timeframe. The gap between the bands confirms a negative trend unless a reversal takes place.
On the other hand, the Stochastic Relative Strength (RSI) at the bottom of the chart also displays the pair in an overbought zone. This signals the price may fall for a short period.
Traders should watch the $65.29 level, as a break below may signal a further downtrend towards $55.73, while a recovery may signal the beginning of a reversal.
QNT/USD Medium-term Trend: Bullish (4H Chart)
Activities are quite different in the 4H timeframe, as volume is slightly rising. This reflects increased interest in the current bullish move. Though the price is currently trading at $71.88 and more bullish momentum is building up, Stochastic RSI is approaching the overbought territory. This signifies the upward movement may face a potential pullback soon.
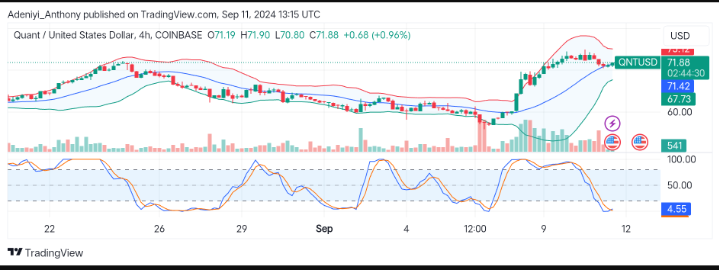
However, if the pair maintains its up trajectory above $75.12, it will aim higher for the psychological level at $80, but a break below $71.42 could see the price drop up to the $60 level.
Finally, the overall condition in this timeframe is bullish, but indicators signal that QNT/USD is operating in the overbought region.
A cautious approach would be necessary, as a pullback could be imminent before any continuation.
In order to place winning trades with us via Bybit, you can open an account here.