Arbitrum Price Prediction: ARB/USD Shows Signs of Potential Rebound in Consolidation
Estimated Reading Time: 3 minutes
Don’t invest unless you’re prepared to lose all the money you invest. This is a high-risk investment and you are unlikely to be protected if something goes wrong. Take 2 minutes to learn more
Arbitrum Price Prediction: September 10, 2024
The Arbitrum against the United States Dollar has generally remained bearish since May.
ARB/USD has been trading with fluctuating momentum characterized by lower highs and lows. However, the current consolidation phase at $0.5263 and the rising Stochastic Relative Strength Index (RSI) suggest a possible short-term reversal. Traders should watch out for technical levels for potential breakouts or breakdowns.
ARB/USD Long-term Trend: Ranging (Daily Chart)
Key Levels:
Resistance Levels: $0.5290, $0.6077, and $0.8000
Support Levels: $0.4000, $0.4500, and $0.5160
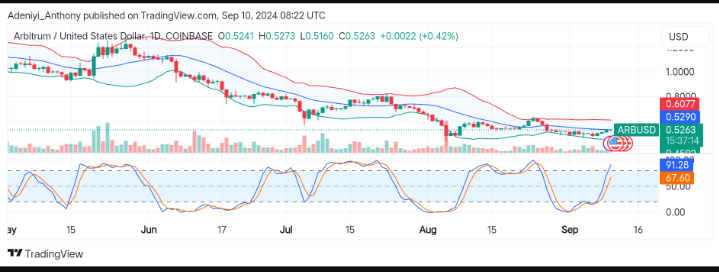
Today, ARB/USD hovers slightly above the immediate support level, with the price attempting to hold its ground around the $0.5263 level. This reflects some buying interest, but the general market sentiment is still bearish unless the pair can decisively slice through $0.5290.
Arbitrum Price Prediction: What Lies Ahead for ARB
Currently, Arbitrum remains trapped within the narrow range of the Bollinger Band. A break above the middle line ($0.5290) could see the pair test further resistance levels, signifying a potential bullish reversal.
Conversely, if ARB/USD fails to hold above $0.5160, a longer-term bearish trend might be initiated.
The Stochastic RSI on the downside of the chart suggests the market may be due for correction very soon as the pair is in an overbought region.
At this point, traders should wait for clearer signs as trading volume is relatively low.
ARB/USD Short-term Trend: Bullish (4H Chart)
While everything seems unclear on the daily chart, ARB/USD shows a recent upward movement after a ranging period on the 4H chart.
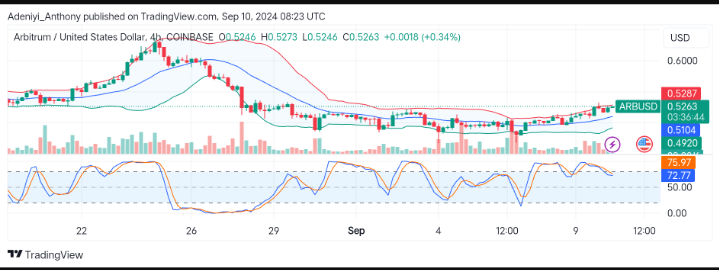
The price is currently at $0.5263, a point above the middle band, which indicates that the pair is experiencing upward pressure. However, if enough bullish strength is not found in the market, a pullback is possible.
The Stochastic RSI, which is in an overbought zone, and the relatively low volume indicate the market may face more selling pressure soon.
The market is currently at a critical juncture; what traders should be on the lookout for includes increased volume or signs of change in direction in the technical indicators for confirmation of direction.
In order to place winning trades with us via Bybit, you can open an account here.