Ethereum (ETH/USDT) Struggles as Market Faces Selling Pressure
Estimated Reading Time: 3 minutes
Don’t invest unless you’re prepared to lose all the money you invest. This is a high-risk investment and you are unlikely to be protected if something goes wrong. Take 2 minutes to learn more
The market for Ethereum against Tether appears to be struggling, operating around the same spot for an extensive period of time. As it stands, the price seems to be testing crucial support levels as the technical indicators reflect a bearish sentiment.
As it stands, on-chain data shows consistent selling pressure, as the pair failed to break above recent resistance levels, as crypto news signals a lack of direction.
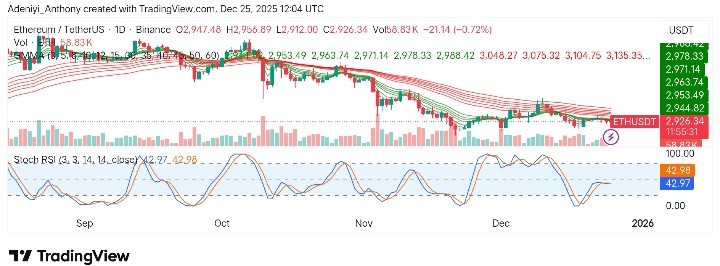
Currently, Ethereum trades at $2,926.34 with more than 58,800 traded volumes on the daily timeframe.
Technical Indicators
Major Resistance Levels: $2,946, $3,075, and $3,135
Major Support Levels: $2,918, $2,830, and $2,800
Technical Analysis
Technically, Ethereum against Tether on the daily chart appears to be building a base at $2,900 after a strong downtrend from $3,400 in recent times.
At the time of writing, the pair is operating under the cluster of Guppy Multiple Moving Averages (GMMA) with a bearish sentiment. However, recent actions suggest the price is preparing for a directional break. This is evident as the Stochastic RSI signals an extension of the range-bound activity.
To this end, an improvement alone from the indicators without a move to $2,975 doesn’t warrant an upside move, as any point below that would indicate further downside.
$ETH
Ethereum is sitting in the same micro support zone as before. There’s no change to the outlook at this stage. A move above $2,975 would still be the first indication that a short-term low may be in place. pic.twitter.com/QSa7PMVbAh— More Crypto Online (@Morecryptoonl) December 24, 2025
$ETH
Ethereum is sitting in the same micro support zone as before. There’s no change to the outlook at this stage. A move above $2,975 would still be the first indication that a short-term low may be in place. pic.twitter.com/QSa7PMVbAh— More Crypto Online (@Morecryptoonl) December 24, 2025
Meanwhile, @Morecryptoonline suggests Ethereum is currently positioned within the same micro support zone as before. As it stands, the analyst is of the opinion that a move above $2,975 would serve as the first indication that a short-term low may have been reached, and a potential upward shift is in play.
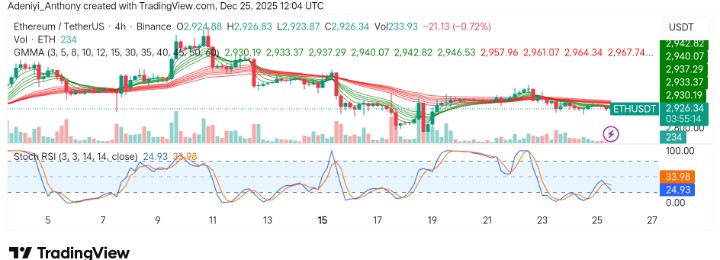
ETH/USDT Analysis: Operating Within Same Zone: What’s Next?
On the 4-hour chart, ETH/USDT seems to be operating within a tight space over an extensive period of time. As it stands, the GMMA lines are technically showing that both scalpers and investors are Unsure of the direction. Meanwhile, the SRSI is showing the market is neutral. To this end, caution is advised, as a breakout to either side remains indecisive.
You can purchase crypto coins here. Buy Crypto