Ethereum (ETH/USDT) Struggling at Key Resistance Levels Amid Mixed Momentum
Estimated Reading Time: 3 minutes
Don’t invest unless you’re prepared to lose all the money you invest. This is a high-risk investment and you are unlikely to be protected if something goes wrong. Take 2 minutes to learn more
The market for Ethereum against Tether has fallen 3.23% to the $2,800 zone over the past 24 hours, showing the market is underperforming the broader crypto market, which dropped 1.1%, extending the 7-day 11.92% loss.
Furthermore, Ethereum’s bearish momentum was further fueled by $196.6 million in outflows from ETH spot ETFs on August 18. This evidence shows that the pair continues to break through key technical support levels.
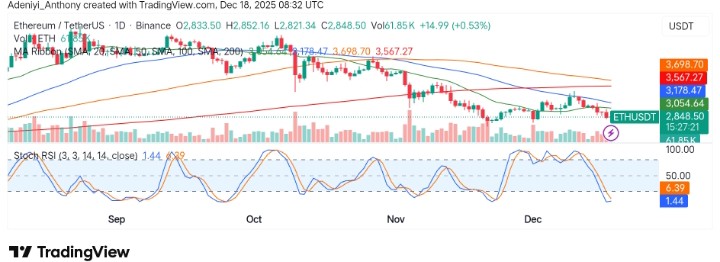
Currently, Ethereum trades at $2,848.50, with more than 61,500 traded volumes for the day.
Technical Indicators
Major Resistance Levels: $2,950, $3,100, and $3,500
Major Support Levels: $2,800, $2,700, and $2,650
Technical Analysis
Technically, Ethereum against Tether oscillates around a key support level, with the price pushing against $2,800 underneath the critical moving average cluster.
However, the Stochastic RSI on the daily chart is nearing oversold territory, indicating potential bullish momentum if price breaks the immediate upper limit. Meanwhile, the operation of the price below the moving averages suggests an impending break, indicated by the momentum oscillator, can only happen if these resistances are cleared.
To this end, a move back into the $3,000 zone is the first step towards a breakout; otherwise, a move into the $2,700 zone would suggest further decline.
Update on Ethereum
Nothing has really happened in the Ethereum market on the daily timeframe; the token appears to be moving sideways after falling below $3,038, extending to the south. However, this does not suppose a bullish move cannot surface at the moment, but a break above $3,100 must be seen to confirm such a move. As it stands, the possibility of another low is imminent unless momentum holds above the immediate micro resistance level.
ETH/USDT Analysis: Is a Reversal Possible?
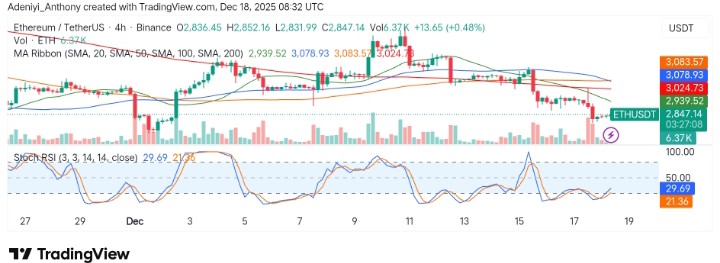
On the 4-hour chart, ETH/USDT appears to be under the cluster of moving averages, further establishing the bearish setup. The pair seems to be experiencing a pullback after an unsuccessful attempt at a breakout around $3,080.
However, the lines of the Stochastic oscillator appear to be indicating a possible minor rebound is on the way as Ethereum is struggling to stay above $2,950. To this end, the 4-hour chart suggests a period of consolidation, potentially before a larger breakout or continuation downwards.
You can purchase crypto coins here. Buy Crypto