Ripple Declines to the Range Bound Zone as Buyers Recoup above $0.33
Estimated Reading Time: 2 minutes
Don’t invest unless you’re prepared to lose all the money you invest. This is a high-risk investment and you are unlikely to be protected if something goes wrong. Take 2 minutes to learn more

Free Crypto Signals Channel
Ripple (XRP) Long-Term Analysis: Bearish
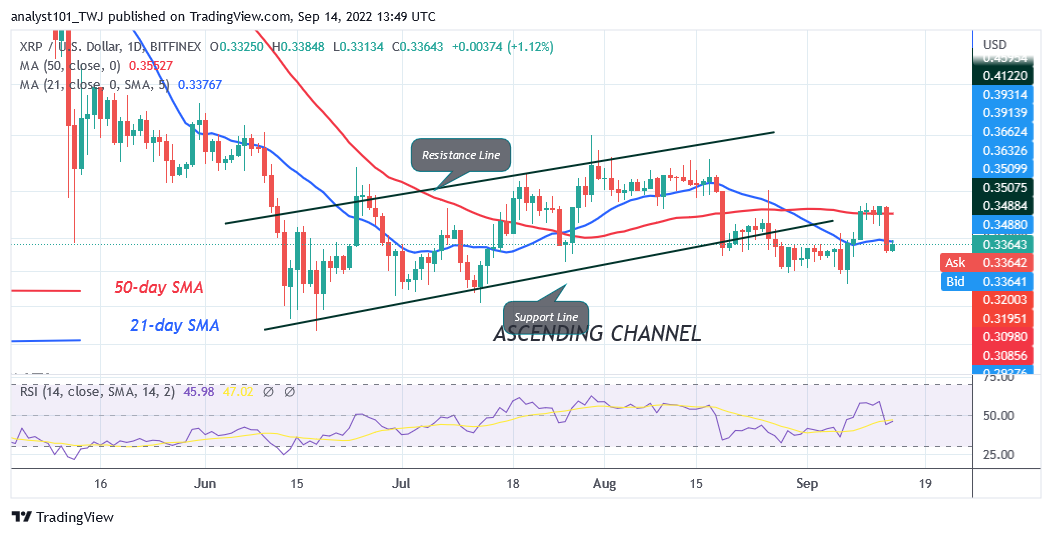
Ripple’s (XRP) price is in a downward correction as buyers recoup above $0.33. On September 9, buyers attempted to push XRP above the 50-day line SMA. They could not sustain the bullish momentum above the moving average lines, hence the decline. On September 13, XRP dropped sharply below the moving average lines. In the meantime, XRP/USD will be trading between the $0.32 and $0.34 price levels. Nevertheless, if XRP rebounds, the altcoin will revisit the resistance at $0.39 and $0.41 price levels. On the other hand, if crypto declines and breaks below the $0.32 support, the market will further decline to the lows $0.32 and $0.30 price levels.
Ripple (XRP) Indicator Analysis
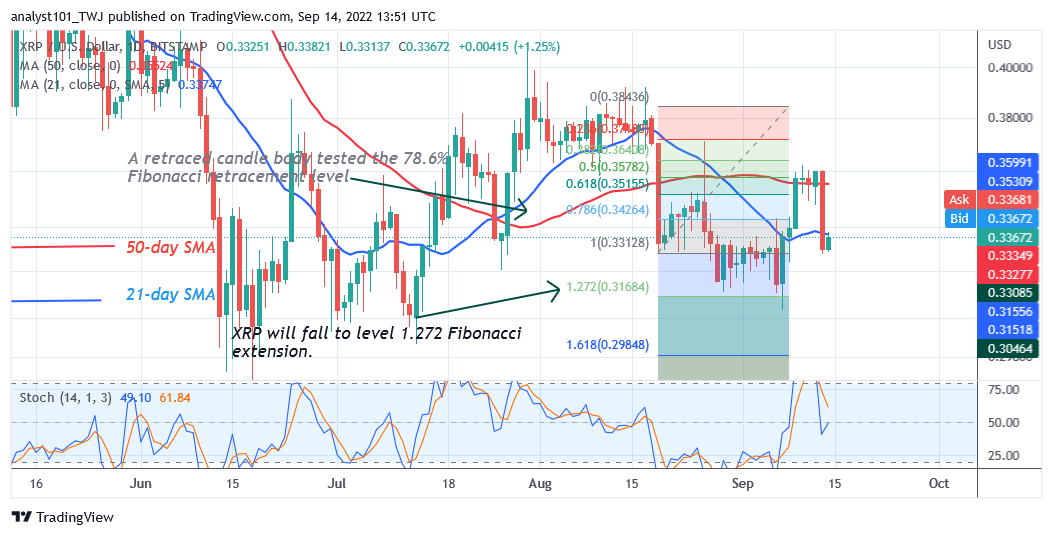
Ripple is at level 47 of the Relative Strength Index for period 14. XRP is trading in the bearish trend zone because of the recent decline. XRP’s price is below the moving average lines which suggests that the altcoin will further decline. The altcoin is below the 60% range of the daily stochastic. It indicates that XRP is in a bearish momentum.
Technical indicators:
Major Resistance Levels – $0.80, $1.00, $1.20
Major Support Levels – $0.60, $0.40, $0.20
What Is the Next Direction for Ripple (XRP)?
Ripple is in a downtrend as buyers recoup above $0.33. Buyers are attempting to push the crypto’s price above the 21-day line SMA. The altcoin will be compelled to a range-bound move if price breaks above the 21-day line SMA.
You can purchase crypto coins here. Buy LBLOCK
Note: Cryptosignals.org is not a 1a financial advisor. Do your research before investing your funds in any financial asset or presented product or event. We are not responsible for your investing results