Tamadoge (TAMA/USD) Gears Up for a Robust Bullish Surge
Estimated Reading Time: 3 minutes
Don’t invest unless you’re prepared to lose all the money you invest. This is a high-risk investment and you are unlikely to be protected if something goes wrong. Take 2 minutes to learn more
In the dynamic landscape of the cryptocurrency market, TAMA/USD has garnered noteworthy interest as it prepares for a robust bullish trend. On October 26, the market retraced to a pivotal support level at $0.008. The historical resilience of this support, which has been in place since September, provides a strong indication that it is likely to continue holding over the long term. This assertion is further supported by the decreasing volatility observed at this level. Therefore, there is a high degree of confidence that the market will experience an upward rebound from this established support level.
Key Levels
- Resistance: $0.013, $0.014, and $0.015.
- Support: $0.00800, $0.0075, and $0.0073.
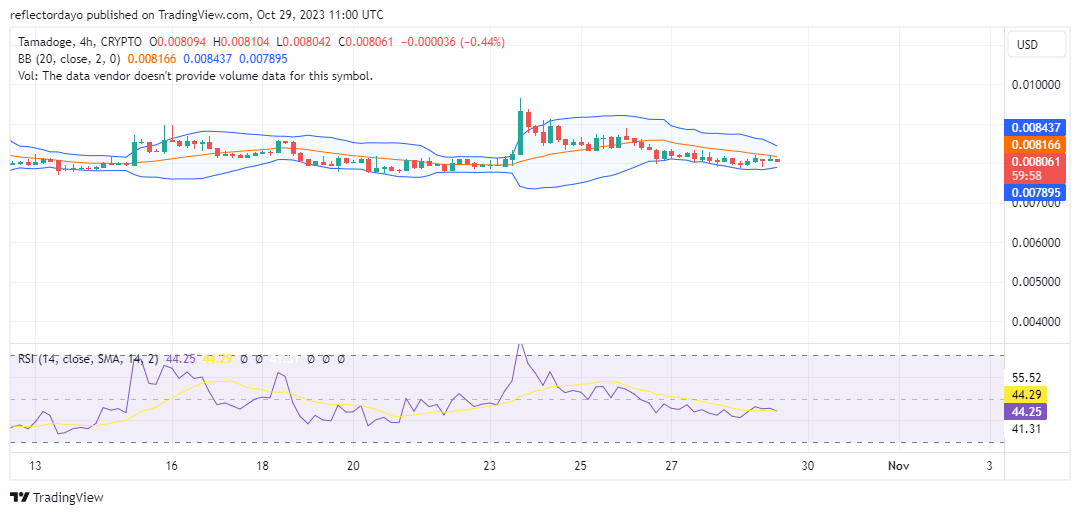
TAMAUSD Price Analysis: The Indicators’ Point of View
As the market maintains a sideways trajectory above the critical $0.008 price level and oscillates within a tightening price range, the Bollinger Bands are gradually converging around this price action. This convergence serves as a signal that a price breakout is imminent, most likely in an upward direction.
However, when examining the market’s performance within this narrow price range, it becomes apparent that the current price action is trading below the 20-day moving average. This suggests a prevailing bearish sentiment, with bears holding sway. As the Bollinger Bands contract, the impending breakout may lean toward the downside.
Nevertheless, considering the historical performance of the TAMA/USD market, there is reason to anticipate an eventual shift towards an upward price movement.

Tamadoge Short-Term Outlook: 1-Hour Chart
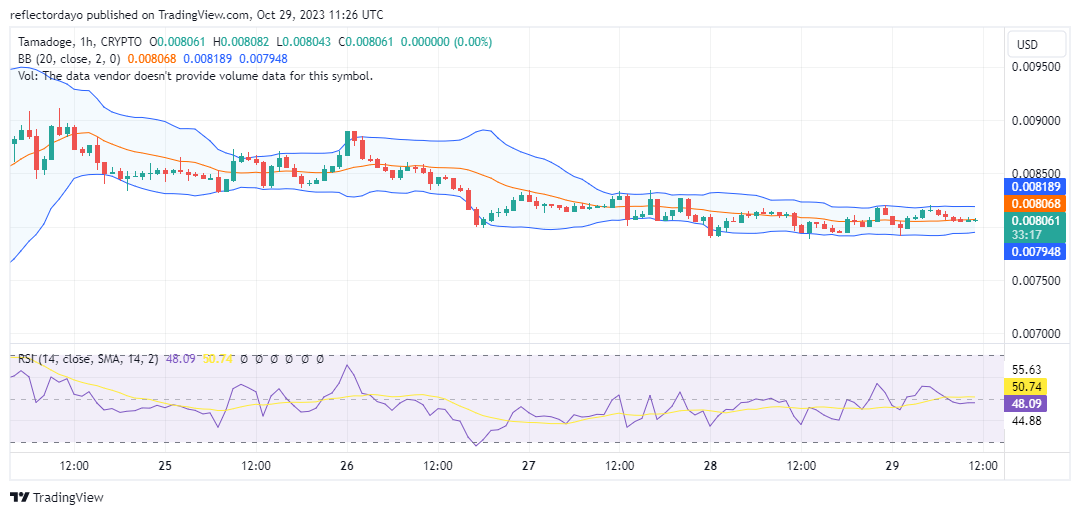
While the market appears to be consolidating just below the 20-day moving average in the 4-hour timeframe, it is noteworthy that, in the 1-hour timeframe, the market is holding steady right along the 20-day moving average. This alignment indicates a state of equilibrium within the market. Additionally, the Relative Strength Index (RSI) confirms this equilibrium.
However, it’s worth pointing out that the RSI line exhibits a series of higher lows, which could be interpreted as a sign of a burgeoning bullish trend. Notably, this development is underpinned by a support level that is forming just slightly below the key support level at $0.0079.
With great pleasure, we announce the addition of our new pet store to the recently renovated Tamadoge Arena.
We’re pleased to announce that we’ve upgraded Tamadoge Arena to include our new Pet Store 🎉
New Players get a free Puppy NFT and 20 free credits to play. Download now to check it out 👇
📱 Android: https://t.co/INCaGendE4
📱 iOS: https://t.co/Fj9tT5Oicu pic.twitter.com/AIAExGPEve— TAMADOGE (@Tamadogecoin) October 27, 2023
Do you want a coin that will be 100 times more valuable in the next few months? That is Tamadoge. Buy TAMA today!