SPONGE/USD ($SPONGE) Begins Another Bull Cycle Slightly Below $0.00010 Price Mark
Estimated Reading Time: 3 minutes
Don’t invest unless you’re prepared to lose all the money you invest. This is a high-risk investment and you are unlikely to be protected if something goes wrong. Take 2 minutes to learn more
While the previous bullish cycle commenced significantly below the current support level, it began precisely at $0.000096. The $0.00010 price level has emerged as a pivotal point within the SPONGE/USD market, particularly during the past month of September. The previous bullish surge, which propelled the market to a peak of $0.0001050, initiated from the $0.000096 mark due to a sudden surge in bearish pressure throughout the previous month, prompting the bulls to regroup at this level. With the present elevated support level, the market may potentially attain even higher price levels.
Key Levels
- Resistance: $0.000115, $0.000120, and $0.000125.
- Support: $0.000090, $0.000080, and $0.000085.
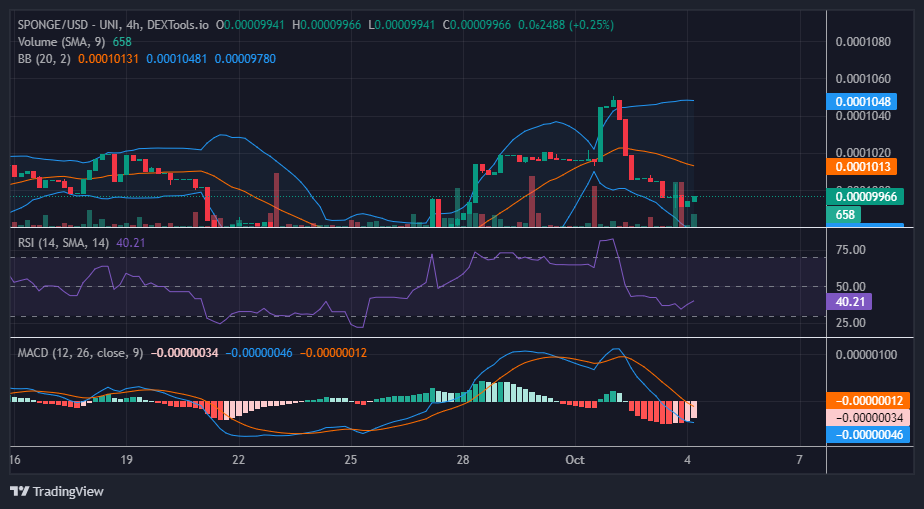
Sponge (SPONGE/USD) Price Analysis: The Indicators’ Point of View
Upon examination of the 4-hour chart, we observe the SPONGE/USD market’s resurgence from levels beneath the 20-day moving average. While this recovery appears to be in its initial stages and is not yet prominently reflected in the Relative Strength Index (RSI), the Moving Average Convergence and Divergence (MACD) exhibits more compelling signs of recuperation. The MACD histograms have transitioned from a deep red hue to a paler shade, indicating a decrease in height. This change is attributed to traders strategically buying the dip around the $0.000099 price point. Furthermore, the trading volume indicator underscores substantial activity supporting the ongoing bullish resurgence.
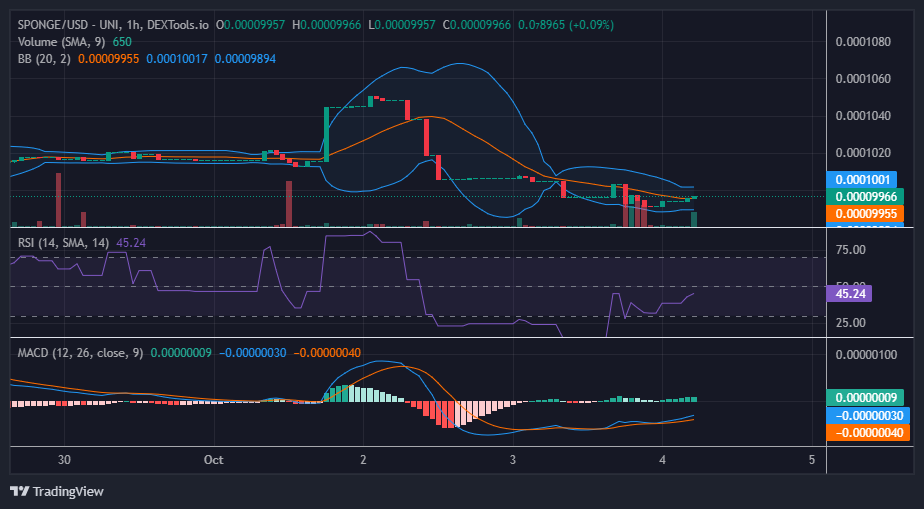
$SPONGE Short-Term Outlook: 1-Hour Chart
Analyzing the 1-hour chart, we can observe a more pronounced bullish recovery. However, the bullish momentum faced resistance near current levels before triggering a positive sentiment. While the indicators suggest that the bullish rebound has not yet completely transitioned the market out of the bearish zone, it is on the cusp of entering bullish territory. It is anticipated that the forthcoming bullish cycle will propel the market towards the $0.00011 price range.
Season 1 of the SPONGE/USD airdrop is winding down and the enthusiasm is off the charts!
🚀 Eager to lock in your spot on the $SPONGE #Airdrop leaderboard? 🧽💥
📆 Season 1 is winding down and the enthusiasm is off the charts! 🌟🧽
💱 Enhance your standings through #Hodling and trading $SPONGE #Tokens! 💪🧽
🌐 https://t.co/lzRhjW4oLL pic.twitter.com/EqqhVtL9IQ
— $SPONGE (@spongeoneth) October 4, 2023
Invest in the hottest and best meme coin. Buy Sponge ($SPONGE) today!