SPONGE/USD ($SPONGE) Presents Another Opportunity to Maximize Profit
Estimated Reading Time: 4 minutes
Don’t invest unless you’re prepared to lose all the money you invest. This is a high-risk investment and you are unlikely to be protected if something goes wrong. Take 2 minutes to learn more
The $SPONGE market has witnessed some significant price movements in recent days. Starting on September 25, the market initiated an upward trend, indicating a positive sentiment among traders and investors. However, as it reached the $0.0001015 price level, it entered a consolidation phase, which contributed to the strengthening of this level as a support.
During this consolidation period, traders seemed to find confidence in the $0.0001015 support level, as it held firm for an extended period. This support level acted as a solid foundation for the subsequent bullish rally that pushed the market closer to the $0.0001050 price mark.
Key Levels
- Resistance: $0.000115, $0.000120, and $0.000125.
- Support: $0.000090, $0.000080, and $0.000085.
Sponge (SPONGE/USD) Price Analysis: The Indicators’ Point of View
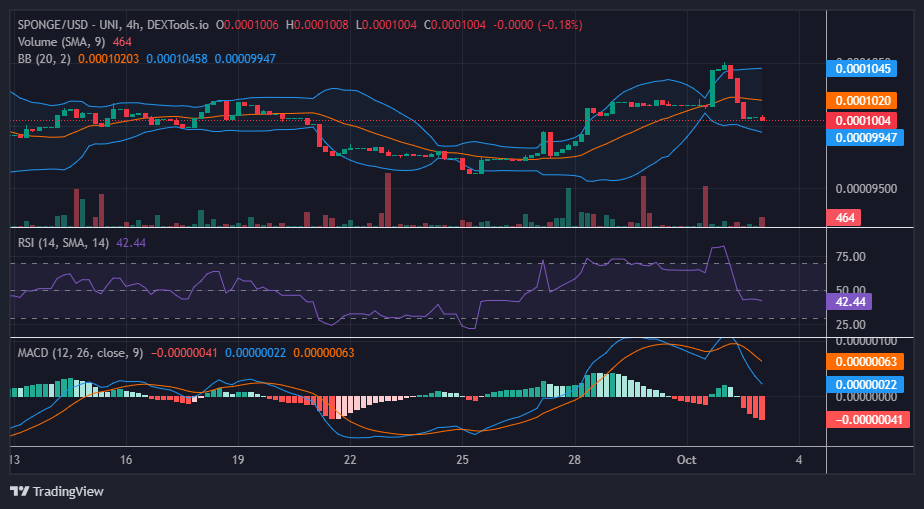
Although the $SPONGE bullish momentum was strong, it couldn’t be sustained at this higher level, resulting in a notable bearish correction. This bearish run caused the market to dip below the critical $0.0001015 support level, which had previously shown its strength.
Analyzing the market through various indicators, it becomes apparent that the recent price retracement has shifted the sentiment back into bearish territory. Presently, the market is moving in a sideways pattern within this bearish zone, with traders closely monitoring the $0.00010 threshold for potential price developments.
Looking at the Bollinger Bands indicator, it’s evident that the market is consolidating below the 20-day moving average, indicating a bearish bias in the short term. Similarly, the Relative Strength Index (RSI) suggests that the market is ranging below the midpoint of the RSI indicator, reflecting the current lack of strong buying momentum.
While the Moving Average Convergence and Divergence (MACD) hasn’t quite crossed into the sell zone, the histograms are prominently red, signaling a substantial presence of bearish pressure in the market.
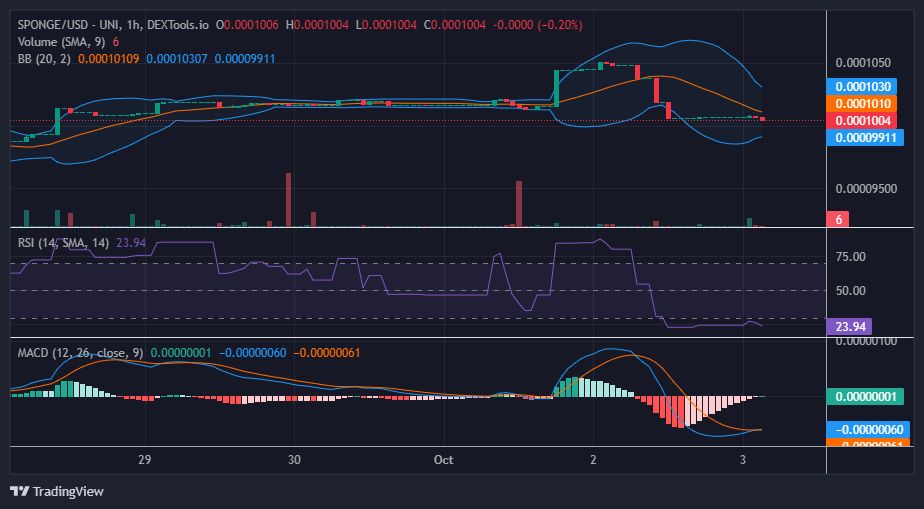
$SPONGE Short-Term Outlook: 1-Hour Chart
Despite the recent bullish surge that propelled SPONGE/USD close to the $0.0001050 level, the market has experienced a notable retracement. These market dynamics have unfolded during the initial three days of October, setting the stage for a potentially intriguing month ahead for $SPONGE traders. Nevertheless, at present, the prevailing indicators are signaling a bearish sentiment, prompting traders to closely monitor the $0.00010 threshold for potential support.
The Moving Average Convergence and Divergence (MACD) indicator provides noteworthy insight, suggesting the possibility of a significant bullish buildup. This is indicated by the diminishing red histograms approaching a crossover into positive territory, accompanied by the convergence of the two curves, which is currently underway.
Don’t let the $SPONGE airdrop pass you by without taking advantage of your chance to participate!
🧽 Don’t miss out on your chance to participate in the $SPONGE #Airdrop before it concludes! 🚀🎁
🌟 Ensure your eligibility by visiting our #Discord server to secure your spot! 🧽✅
🚀 Dive into the airdrop registration details for guidelines! 📝🌊
🔗 https://t.co/lzRhjW4oLL pic.twitter.com/ltQguYIvLF
— $SPONGE (@spongeoneth) October 3, 2023
Invest in the hottest and best meme coin. Buy Sponge ($SPONGE) today!