Lucky Block Price Prediction: LBLOCK/USD Ready to Resume Upward as Price Hits $0.0020
Estimated Reading Time: 3 minutes
Don’t invest unless you’re prepared to lose all the money you invest. This is a high-risk investment and you are unlikely to be protected if something goes wrong. Take 2 minutes to learn more

Free Crypto Signals Channel
In the early hours of today, the Lucky Block price prediction begins a progressive movement as the price increases tremendously before dropping slightly.
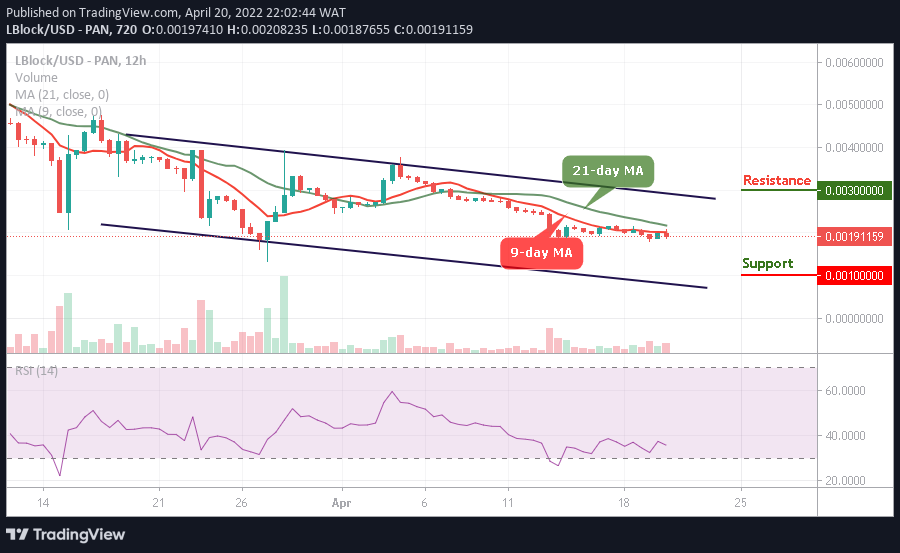
LBLOCK/USD Medium-term Trend: Ranging (12H Chart)
Key Levels:
Resistance levels: $0.0030, $0.0035, $0.0040
Support levels: $0.0010, $0.0008, $0.0005
LBLOCK/USD bulls have been attempting to move above the 9-day moving average. The $0.0018 support level is the critical support where the price touched today. Meanwhile, the Lucky Block price has earlier trades around this level before making an upward movement, and this makes the support level a strong support zone
Lucky Block Price Prediction: LBLOCK Price Will Follow the Uptrend
The Lucky Block price will head to the upside if the bulls could defend the $0.0018 level; the coin may continue its upward movement by breaking above the upper boundary of the channel after pushing the price above the 21-day moving average. Therefore, any further bullish movement may take the coin to the potential resistance levels of $0.0030, $0.0035, and $0.0040.
However, the current analysis may be invalidated should the bears break below the $0.0018 level; this would be the best opportunity for the new buyers to enter the market as the Lucky Block price may fall to the low of $0.0010, $0.0008, and $0.0005 support levels. More so, the technical indicator Relative Strength Index (14) is below the 40-level, getting ready for the upward movement.
LBLOCK/USD Medium-term Trend: Bearish (4H Chart)
On the 4-hour chart, the Lucky Block price is currently trading above the 9-day moving average. However, the red line of the 9-day moving average is going to make make a bullish cross above the green line of the 21-day moving average to touch the nearest resistance of $0.0022.
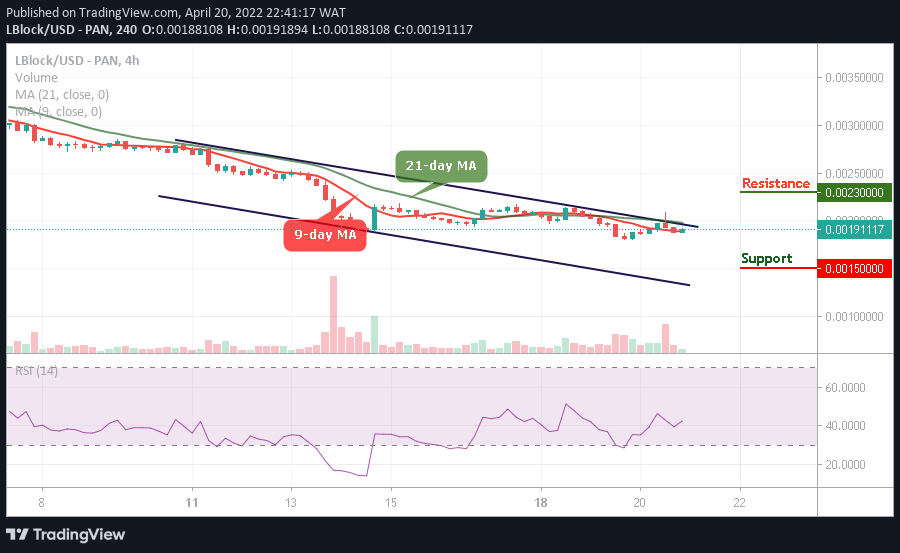
Therefore, if the buyers could push the price above the mentioned resistance, higher resistance lies at $0.0023 and above. Moreover, should the bulls fail to move it upward, then, the nearest support level could be located at $0.0015 SAT and below while the technical indicator Relative Strength Index (14) moves above the 40-level, suggesting bullish signals.
Read more: