Fetch.ai (FET/USD) Mounts Renewed Assault on $3.00 Barrier
Estimated Reading Time: 2 minutes
Don’t invest unless you’re prepared to lose all the money you invest. This is a high-risk investment and you are unlikely to be protected if something goes wrong. Take 2 minutes to learn more
During the recent price surge, Fetch.ai (FET) encountered resistance at the $3.00 level. This level attracted profit-taking from short-term traders (often referred to as “bears”), solidifying it as a resistance zone. While a downward correction was anticipated, buying pressure emerged around $2.50, preventing a significant decline. Currently, the price appears to be consolidating near $2.50.
Fetch.ai Market Data
- FET/USD Price Now: $2.6243
- FET/USD Market Cap: $221 million
- FET/USD Circulating Supply: 835 million
- FET/USD Total Supply: 1.2 billion
- FET/USD CoinMarketCap Ranking: #52
Key Levels
- Resistance: $3.00, $3.50, and $4.00.
- Support: $2.00, $1.50, and $1.00.
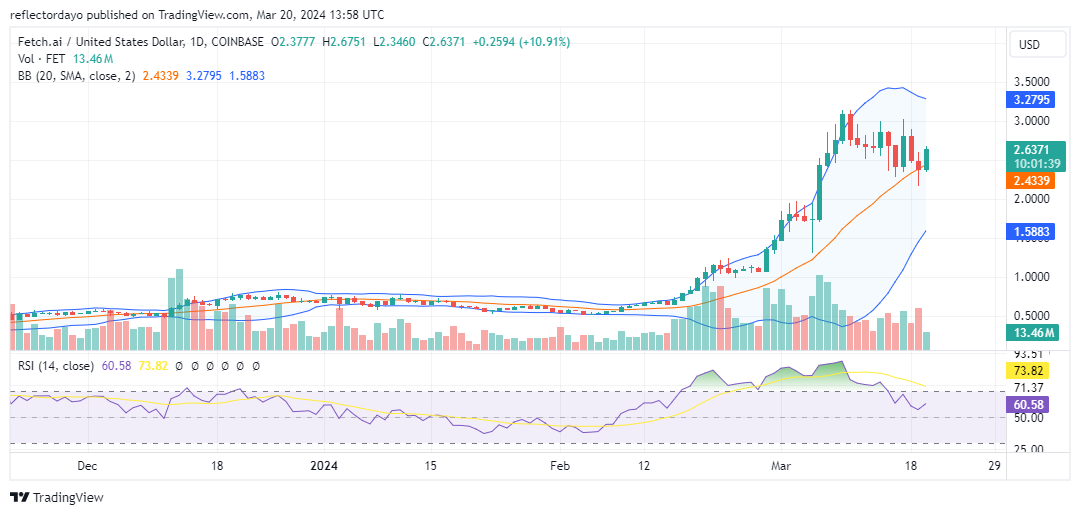
Fetch.ai Market Analysis: The Indicators’ Point of View
Analysis of the Fetch.ai (FET) chart reveals a potential shift in momentum. A recent dip below the $2.50 level suggests that bears may be regaining some control. However, a renewed push towards $3.00 is still possible. This is supported by the Relative Strength Index (RSI) recovering from overbought territory and currently hovering around 60, indicating some buying pressure remains.
If the bulls are unable to breach the resistance at $3.00 again, this level will likely solidify further. Additionally, a failure to hold the $2.50 support could trigger a more significant decline, potentially seeking support at $1.726.
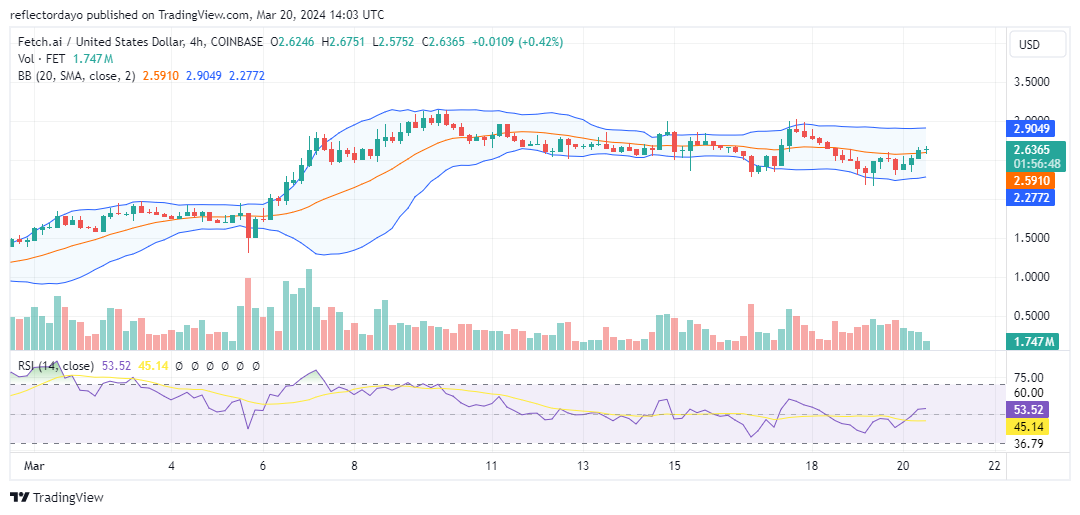
FET/USD 4-Hour Chart Outlook
A shorter-term analysis of the Fetch.ai (FET) market suggests potential consolidation around the $2.50 level. This is evident from the price oscillating within a horizontal channel, indicating buying pressure emerging near $2.50 to counter selling pressure at $3.00. A sustained move below this level could signal increasing bearish dominance, while a decisive break above $3.00 would suggest renewed bullish momentum. Investors should closely monitor price action for signs of a breakout or breakdown from this range.