Lucky Block Price Prediction: LBLOCK/USD Moves Around $0.0018 Level
Estimated Reading Time: 2 minutes
Don’t invest unless you’re prepared to lose all the money you invest. This is a high-risk investment and you are unlikely to be protected if something goes wrong. Take 2 minutes to learn more

Free Crypto Signals Channel
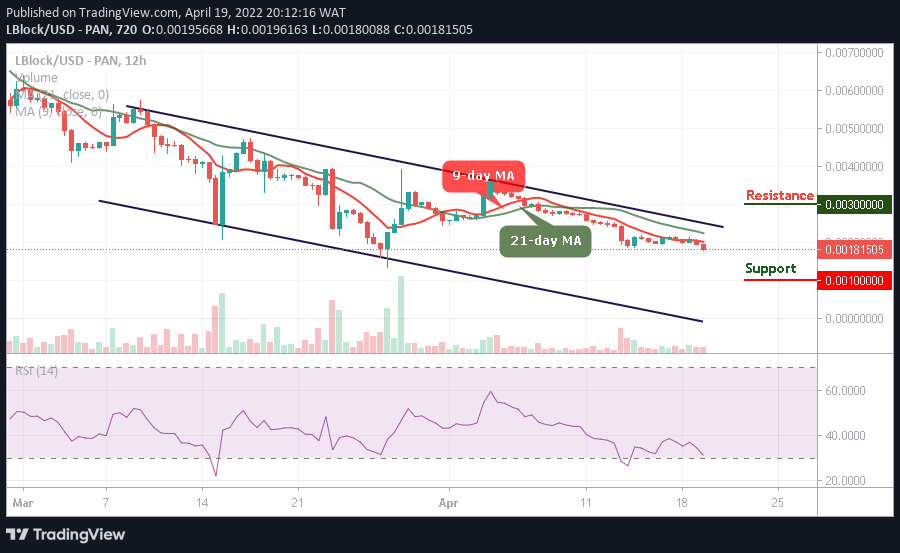
The Lucky Block price prediction is seen moving towards the 9-day and 21-day moving averages to hit the $0.0020 resistance level.
LBLOCK/USD Medium-term Trend: Bearish (12H Chart)
Key Levels:
Resistance levels: $0.0030, $0.0035, $0.0040
Support levels: $0.0010, $0.0008, $0.0005
LBLOCK/USD bulls are trying to push the coin above the 9-day and 21-day moving averages as the technical indicator Relative Strength Index (14) reveals that the market may embark on a positive movement once the signal line moves above the 40-level.
Lucky Block Price Prediction: LBLOCK Price Will Follow the Uptrend
The Lucky Block price is changing hands at $0.0018 where it is currently trading. More so, if the coin breaks the $0.0020 resistance level, the coin may continue its upward movement to cross above the 9-day and 21-day moving averages. Therefore, the nearest resistance levels are located at $0.0030, $0.0035, and $0.0040 while falling towards the lower boundary of the channel may reach the support levels at $0.0010, $0.0008, and $0.0005 respectively giving a fade bullish trading volume.
LBLOCK/USD Medium-term Trend: Bearish (4H Chart)
On the 4-hour chart, the Lucky Block price is moving below the 9-day and 21-day moving averages as the bulls may push the coin to the positive side. On the downside, if the market price moves toward the lower boundary of the channel, the next support level may surface at $0.0016 to locate further key support at $0.0014 and below if the sell-off later becomes huge.

However, on the upside, if the bulls push the price back above the upper boundary of the channel; LBLOCK/USD would face the upside. Further bullish movement may hit the potential resistance level at $0.0023 and above while the signal line of the Relative Strength Index (14) moves away from the oversold region to continue the bullish movement.
Read more: