Ethereum Is Circling above $1,500 and Testing Its Most Recent High
Estimated Reading Time: 2 minutes
Don’t invest unless you’re prepared to lose all the money you invest. This is a high-risk investment and you are unlikely to be protected if something goes wrong. Take 2 minutes to learn more
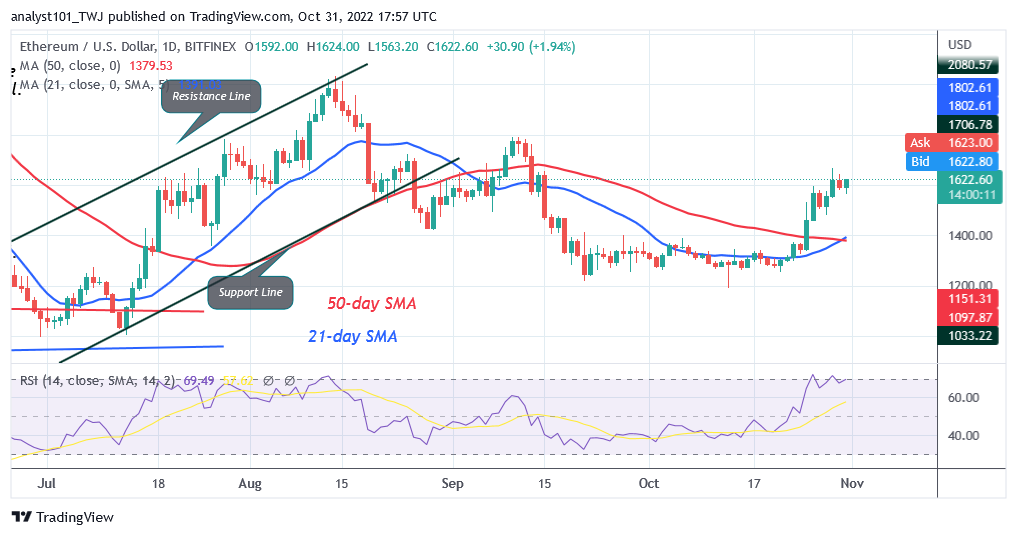
Ethereum Price Long-Term Analysis: Bullish
Ethereum (ETH) price is trading in the bullish trend zone as it declines from the most recent high. Trading in the overbought area is the largest altcoin. The price of Ether varies between $1,400 and $1,600 price . The altcoin will drop to the previous range-bound zone between $1,220 and $1,400 if it reverses below $1,400. The altcoin will return to its former highs of $1,800 and $2,019 if buyers maintain the price over $1,600. Ethereum is currently trading at $1,578 as of this writing.
Ethereum Indicator Analysis
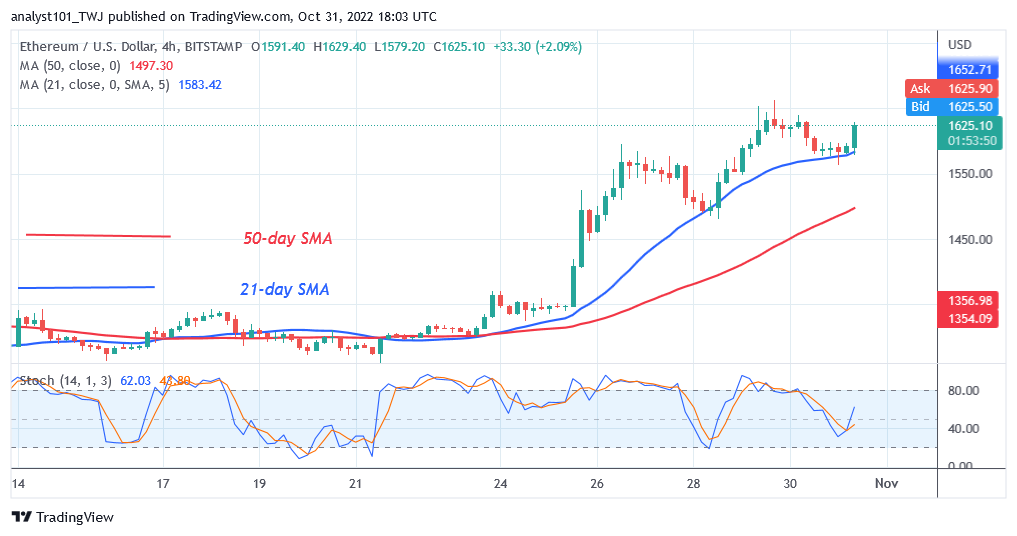
The largest altcoin is at level 65 of the Relative Strength Index for period 14. Because of the price rebound, Ether has rallied to an overbought region of the market. The price bars are above the moving average lines indicating a potential rise of the coin. The altcoin is experiencing overbought conditions as Ether is above the daily stochastic 80% zone.
Technical indicators:
Major Resistance Levels – $2, 600, $2,800, $3,000
MajorSupport Levels – $1.500, $1, 300, $1,100
What Is the Next Direction for Ethereum?
On the 4-hour chart, Ether is in a sideways move below the the most recent high. The altcoin has retraced below the 21-day line SMA. It is fluctuating between the moving average lines for a few more days. Ethereum will trend when moving average lines are breached.
You can crypto coins here. Buy LBLOCK
Note: Cryptosignals.org is not a financial advisor. Do your research before investing your funds in any financial asset or presented product or event. We are not responsible for your investing results