Tamadoge (TAMA/USD): Bulls Poised for a Breakout from $0.0014
Estimated Reading Time: 3 minutes
Don’t invest unless you’re prepared to lose all the money you invest. This is a high-risk investment and you are unlikely to be protected if something goes wrong. Take 2 minutes to learn more

As bearish pressure persists, Tamadoge bulls are struggling to maintain control at the $0.0014 level. Consequently, the price has fallen below this threshold, seeking support around $0.00134, which could potentially serve as a launch pad for a recovery.
The bearish momentum is now encountering significant resistance below $0.0014, with selling pressure sharply diminishing. As a result, the likelihood of a price rebound is increasing. Should this trend continue, the market may rally toward the critical $0.0018 level, signaling a potential shift in momentum.
Key Levels
- Resistance: $0.0018, $0.0019, and $0.0020
- Support: $0.001, $0.0009 and $0.0008
TAMA/USD Price Analysis: The Indicators’ Point of View
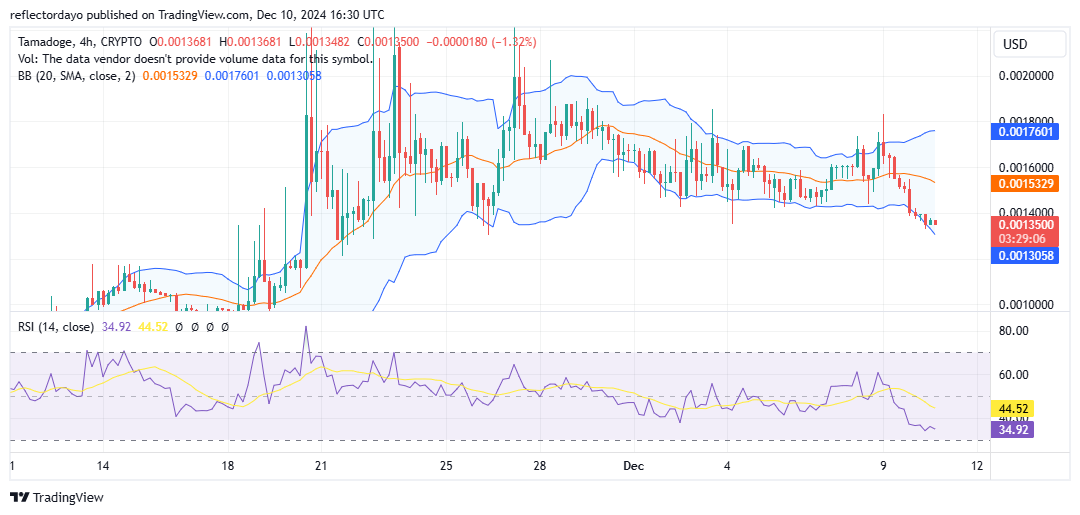
The Bollinger Bands indicator reflects the recent activity of Tamadoge bears, with the lower standard deviation band diverging downward in response to the declining price action. Meanwhile, the Relative Strength Index (RSI) shows a significant drop in momentum, with the RSI line hovering near the 30 level, indicating oversold conditions.
This oversold state suggests the market is increasingly primed for a rally. The RSI’s reading may encourage Tamadoge traders to adopt a more optimistic outlook, potentially triggering a rebound. Such a bounce could set the crypto signal on a trajectory toward the $0.0018 level.
Tamadoge Short-Term Outlook: 1-Hour Chart
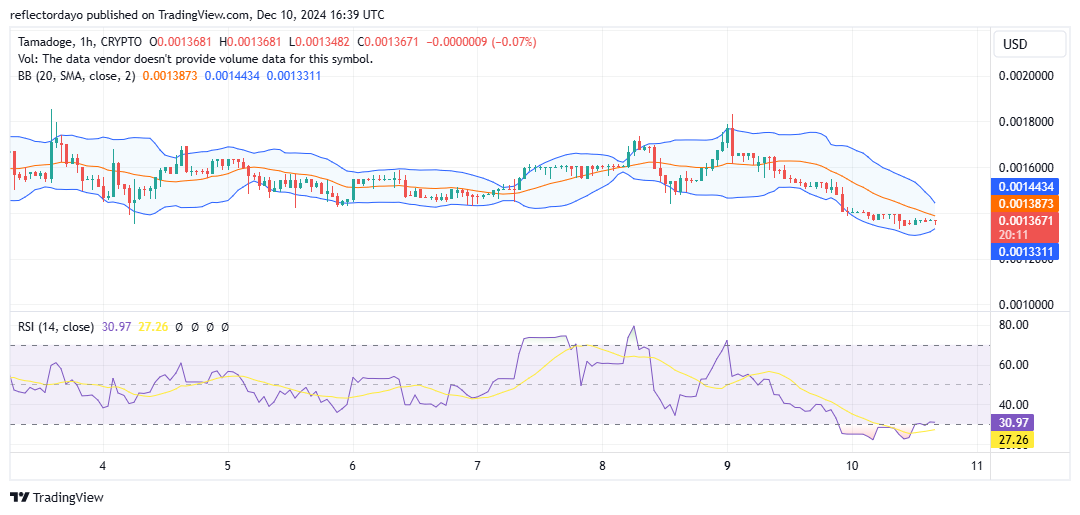
A closer look at the 1-hour chart reveals a downward trending market, although the bearish momentum has significantly slowed, particularly after the price reached the $0.0014 level. This area has shown signs of bullish bias, with bulls attempting to shift the market direction. If buyers can maintain their position, bearish sentiment may soon dissipate.
The Relative Strength Index (RSI) further supports this outlook, with the RSI line attempting to recover from below the 30 level, though it has not yet surpassed this threshold. For investors, this indicates the potential for a bounce and a rally toward the critical $0.0018 level.
Buy TAMA/USD!
There’s no mobile runner out there quite like #TamadogePursuit! 🏃♂️
1️⃣ Sign up – start with 20 free credits for a boost!
2️⃣ Climb up the leaderboards.
3️⃣ Win $TAMA rewards!Play Now! 👇
📱Android: https://t.co/Of8SYALRzL
📱 iOS: https://t.co/IthvqovwAH pic.twitter.com/84HNqob9Rf— TAMADOGE (@Tamadogecoin) September 10, 2024