The API3 Market (API3/USD) Bulls Are Working Toward Achieving the $3.00 Price Target
Estimated Reading Time: 3 minutes
Don’t invest unless you’re prepared to lose all the money you invest. This is a high-risk investment and you are unlikely to be protected if something goes wrong. Take 2 minutes to learn more
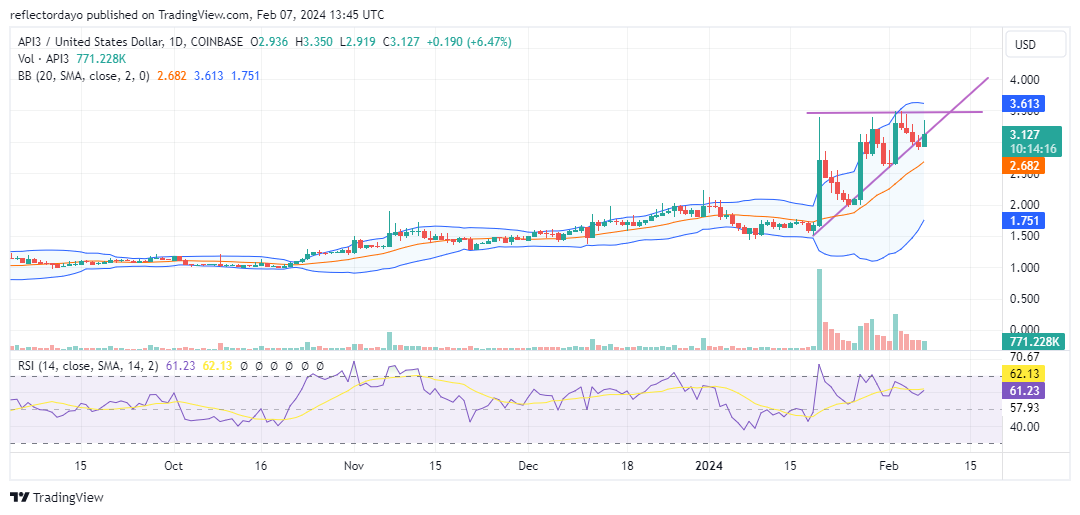
On January 20th, the API3 market experienced a notable bullish breakout. The sudden increase in liquidity within the bullish market propelled the price to surge significantly, leading to a breakout from the consolidation trend observed around the $1.6 price level.
During the surge, the price surged to nearly $3.50, establishing new bullish targets as market participants reacted to the loosening of market constraints, consequently increasing volatility. Utilizing this heightened volatility adeptly, market bulls have managed to establish new higher lows as they steadily progress toward their target objectives.
The API3 Market Data
- API3/USD Price Now: $3.185
- API3/USD Market Cap: $267 million
- API3/USD Circulating Supply: 86 million
- API3/USD Total Supply: 125 million
- API3/USD CoinMarketCap Ranking: #173
Key Levels
- Resistance: $3.30, $3.50, and $4.00.
- Support: $2.93, $2.69, and $2.00.
The API3 Market Analysis: The Indicators’ Point of View
The bullish surge effectively alleviated the previously stagnant market conditions, highlighting the willingness of bullish traders to engage. Capitalizing on heightened volatility, bulls strategically established higher lows, inching closer to the $3.380 price target and heightening the possibility of a breakout. Despite the static nature of the $3.380 resistance level, the API3 market bullish momentum persisted, as evidenced by their willingness to buy at progressively higher levels, exerting increasing pressure on the resistance. This market behavior aligns with the recognizable ascending triangle pattern.
Anticipation mounts that the burgeoning buying pressure will eventually overpower the selling pressure at the resistance level, catalyzing an upward breakout. However, in the event of this scenario failing to materialize, the market may undergo a period of consolidation around the $3.00 price mark, gathering momentum before establishing a definitive market direction.
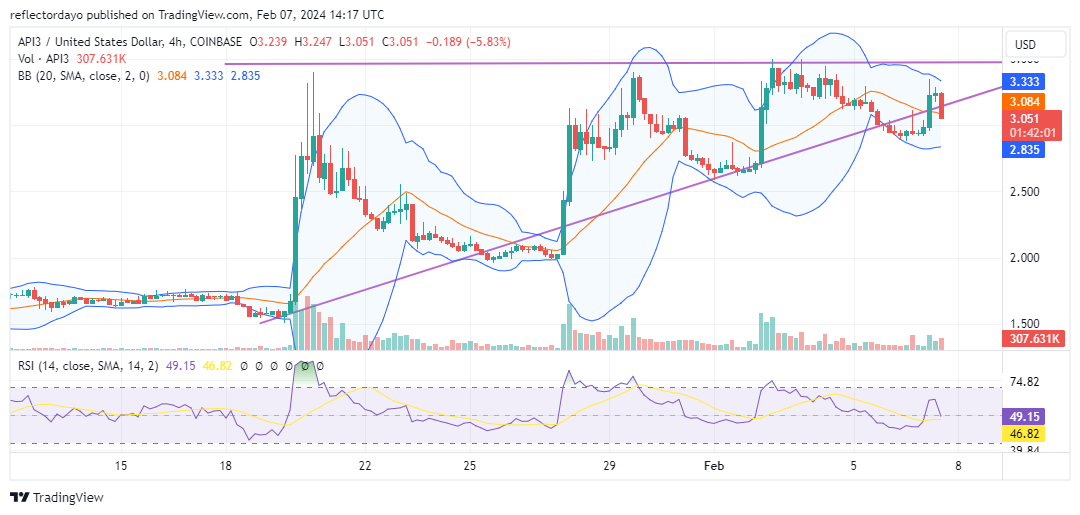
API3/USD 4-Hour Chart Outlook
The ascending triangle pattern is a crypto signal that is also evident when examining the 4-hour chart outlook. However, the likelihood of a consolidation phase around the $3.00 price level is steadily gaining credibility. In today’s trading session, following the breakout above the $3.00 price level in the second 4-hour session, the price has remained consistently above this threshold, even slightly surpassing the 20-day moving average. Confirming the anticipated consolidation phase, the volume trade indicator now displays histograms with diminishing heights.