Orchid (OXT/USD) Maintains Consolidation Phase Following Bullish Intervention at $0.09
Estimated Reading Time: 2 minutes
Don’t invest unless you’re prepared to lose all the money you invest. This is a high-risk investment and you are unlikely to be protected if something goes wrong. Take 2 minutes to learn more
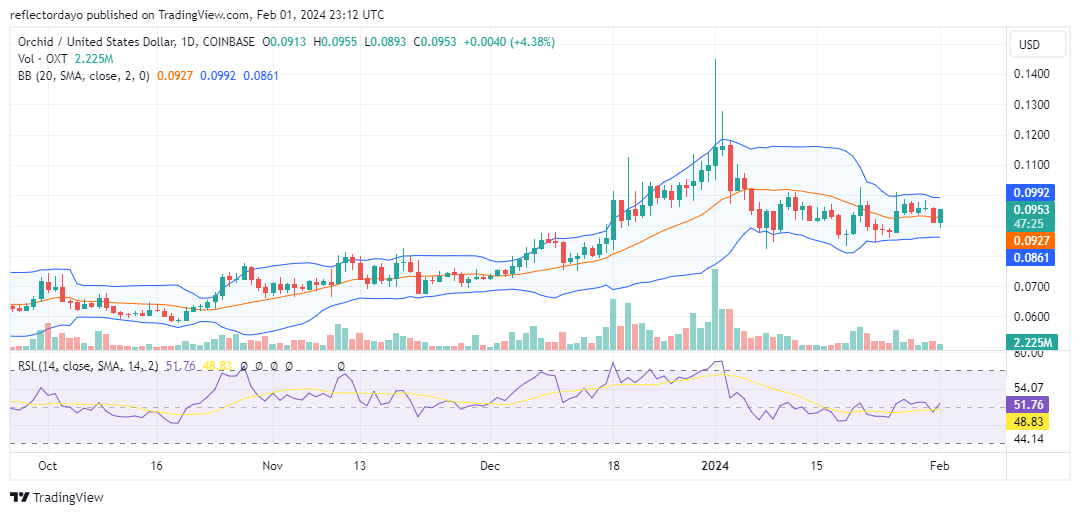
On January 1, the bull market reached its zenith, surging above the $0.14 price level. The significant price increase on that day initiated a substantial Orchid bear market, which has the potential to drive the market to lower price levels. Nevertheless, at approximately $0.09 price levels, traders exhibited a willingness to adopt long positions. This led to a confrontation between bears and bulls at this level, resulting in an ongoing standoff since then.
Orchid Market Data
- OXT/USD Price Now: $0.95
- OXT/USD Market Cap: $93 Million
- OXT/USD Circulating Supply: 979,779,108 OXT
- OXT/USD Total Supply: 1 Billion
- OXT/USD CoinMarketCap Ranking: #359
Key Levels
- Resistance: $0.10, $0.11, and $0.12.
- Support: $0.08, $0.07, and $0.06.
The Orchid Market Crypto Signal: Analyzing the Indicators
The Bollinger Bands indicator has promptly adapted to a horizontal price movement, narrowing around the price action as the ongoing tug-of-war between demand and supply intensifies. Concurrently, in the Relative Strength Index, the bandwidth of the oscillatory movement of the RSI line is decreasing. These crypto signals collectively suggest a significant level of indecision in the market, accompanied by a low volume of trade.
Additionally, it is noteworthy to emphasize the robustness of the support level at $0.09. Given these indicators, there is a likelihood that the Orchid market may favor an upward trajectory as its subsequent price direction follows the consolidation phase.
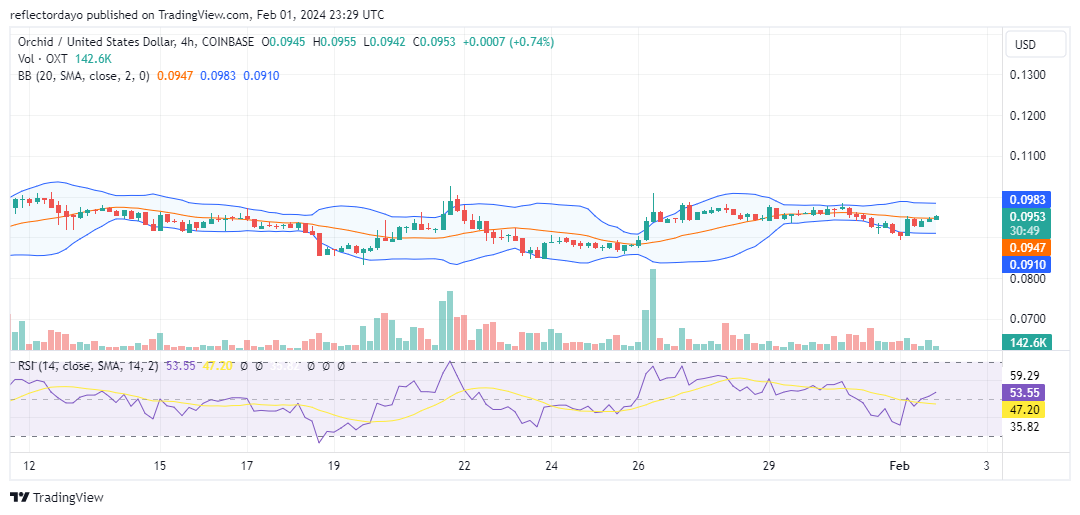
OXT/USD 4-Hour Chart Outlook
In the initial 4-hour trading session on February 1, the bull market firmly established its presence at the $0.09 price level, utilizing it as a launching point for an upward movement. Nonetheless, as the market ascends, there is a noticeable reduction in bullish momentum, indicative of weakness on the part of the bulls. It is important to acknowledge that the bears are also exhibiting a lack of strength. Additionally, the trading volume is low, signaling a potential continuation of the eastward-bound price action for an extended period.