Bitcoin Cash (BCH/USD) Market Recesses at $600
Estimated Reading Time: 3 minutes
Don’t invest unless you’re prepared to lose all the money you invest. This is a high-risk investment and you are unlikely to be protected if something goes wrong. Take 2 minutes to learn more
Bitcoin Cash Price Prediction – September 3
The BTC/USD market recesses around $600 over a couple of weeks’ sessions in the range lines of $800 and $500. The crypto’s book of records has it that price trades around $666 at the percentage rate of about 0.22. That is an indication that the low-price action is still in place.
BCH/USD Market
Key Levels:
Resistance levels: $800, $1,000, $1,200
Support levels: $500, $400, $300
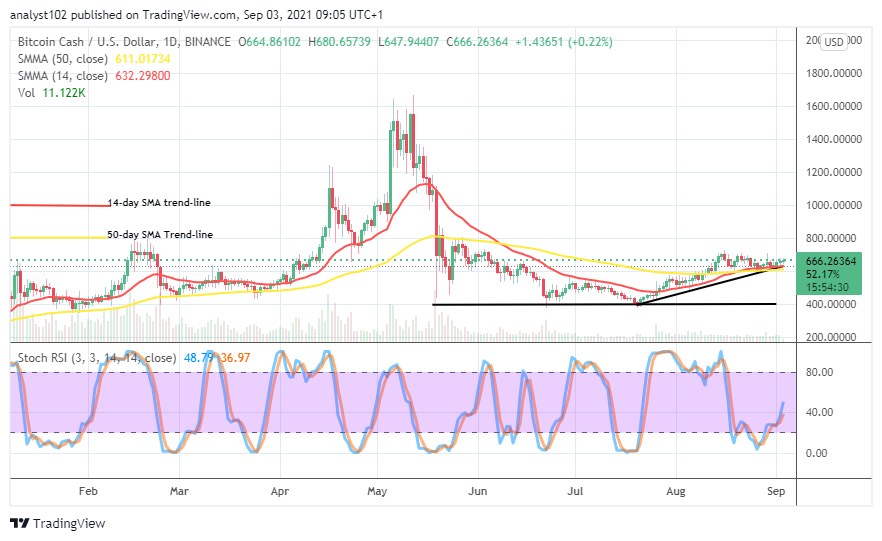
BCH/USD – Daily Chart
The daily chart of BCH/USD depicts that the crypto market recesses around the level of $600 in a continual moving motion characterized by the featuring of smaller candlesticks between the values of $800 and $500. The 14-day SMA trend-line remains conjoined with the 50-day SMA trend-line. The bullish trend-line drew beneath them as a supportive tool. The Stochastic Oscillators have similarly in a conjunctiva-manner swerved briefly northbound against the range of 40. That suggests the possibility of getting ups at a later session.
The BCH/USD market recesses around the $600; will it be further prolonged?
As long as there seems to be a continued low-active price movement on the sides of the major market movers, the BCH/USD market recesses around $600 tend not to end soon. Unlike many other crypto economies that have seen significant motions in their trading operations, Bitcoin Cash hasn’t made any move to substantiate a change in its long kind of ranging trend that it keeps until the present.
On the downside, the market needed to succumb to resistance forces ahead around $800 if the BCH/USD market bears’ capacity will be relevant in this crypto trading activity. But, in the meantime, traders are to await a volatile price action to take place before a clue into a definite direction can be observed. The readings of the Stochastic Oscillators portend an unsafe trading situation to trading on the downside as of writing.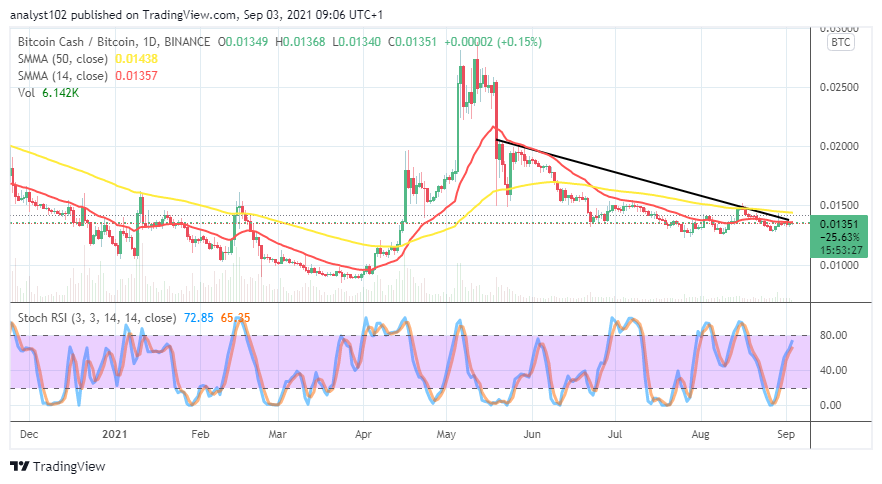
BCH/BTC Price Analysis
The BCH/BTC price analysis chart depicts the trending capacity between the duo-crypto market recesses underneath the trend-line of the bigger SMA. That shows that the base crypto still outweighed by counter crypto to some reasonable extent until now. The 50-day SMA indicator is over the 14-day SMA as the bearish trend-line drew southward to join the smaller SMA trend-line at the tail end in a resistant format to the trading zone of the market. The Stochastic Oscillators have reluctantly moved closer to the range of 80. That indicates that the base crypto is striving to regain its stance pairing with the most valuable counter trading crypto.
Note: Cryptosignals.org is not a financial advisor. Do your research before investing your funds in any financial asset or presented product or event. We are not responsible for your investing results.
You can purchase crypto coins here. Buy Tokens